Click the "+" next to any topic in which you are interested.
Bushmeat
Coming soon...
Cellular Respiration
|
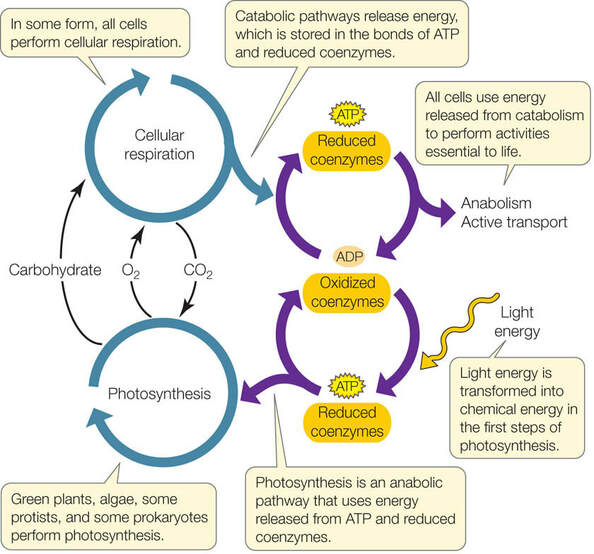
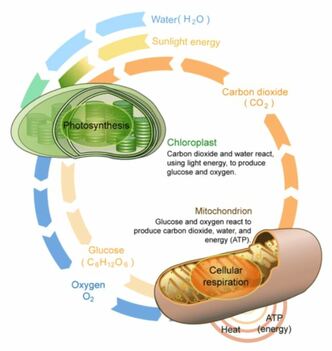
Energy is the currency of life: all living organisms require energy to survive and reproduce. Metabolism is the series of reactions and processes, catalyzed by enzymes, which together maintain life. These reactions fall into one of two types.
|
|
There are two general classes of cellular respiration that are characterized by their relative efficiency (ATP production): anaerobic and aerobic respiration.
Anaerobic respiration is much less efficient than aerobic respiration (about 2 ATP yield per cycle vs 34-38). The two forms of anaerobic respiration (alcoholic fermentation and lactic acid fermentation) occur outside the mitochondria, in the cytoplasm of the cell, meaning the process can occur in simpler cells that may lack complex structures like the mitochondria. Aerobic (“complete” or “oxygen-dependent”) respiration is a highly efficient process occurring within the mitochondria of eukaryotic organisms that have higher energy requirements for survival. Oxygen and glucose are used to produce energy (ATP), H2O, and CO2. |
|
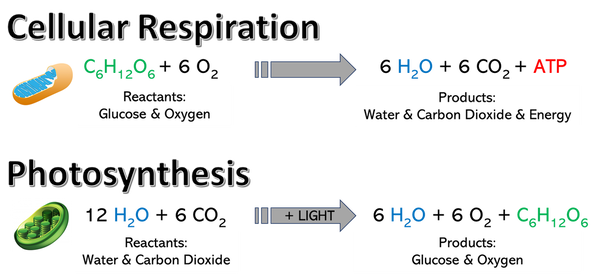
In general, there are three steps to aerobic respiration: (1) glycolysis, (2) the Krebs Cycle (also called Citric Acid Cycle), and (3) oxidative phosphorylation. One cycle produces 6 H2O molecules, 6 CO2 molecules, and ~38 ATP.
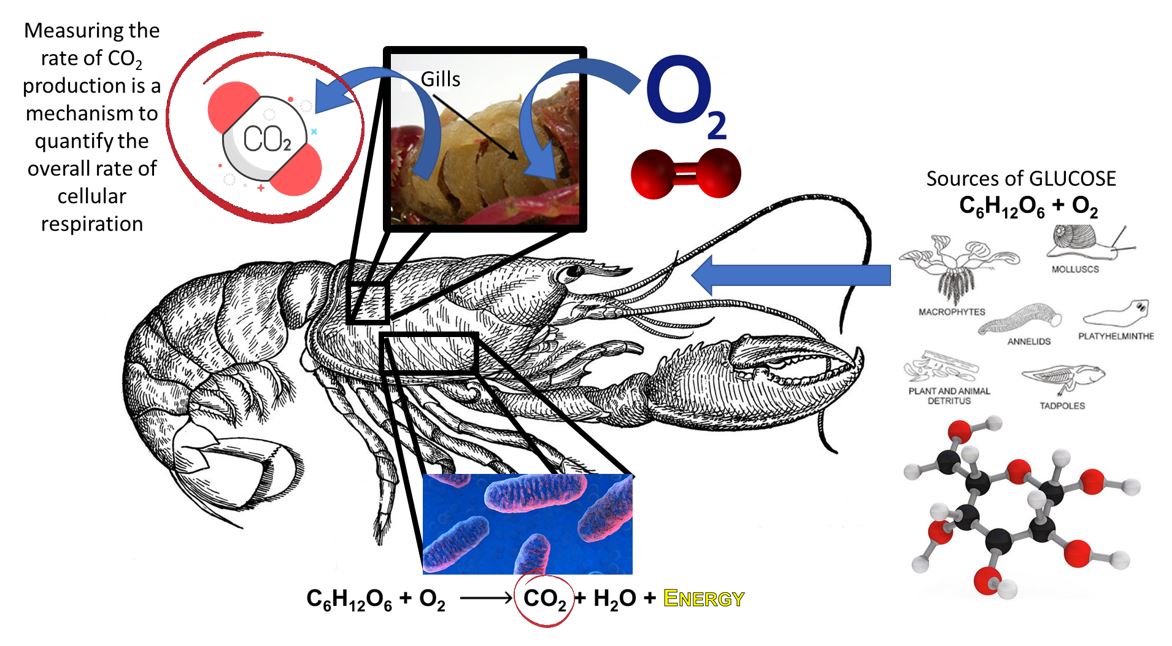 Cellular Respiration in the Crayfish
Chloroplasts
|
Kim, S. J., Hahn, E. J., Heo. J. W., and Paek, K. Y. 2004. Effects of LEDs on net photosynthetic rate, growth and leaf stomata of chrysanthemum plantlets in vitroAuthor links open overlay panel. Scientia Horticulturae, 101 (1–2), 143-151. Matsuda, R., Ohashi-Kaneko, K., Fujiwara, K., Goto, E., and Kurata, K. 2004. Photosynthetic Characteristics of Rice Leaves Grown under Red Light with or without Supplemental Blue Light. Plant & Cell Physiology, 45(12), 1870-1874. |
|
Long, A., Zhang, J., Yang, L. T., Ye, X., Lai, N. W., Tan, L. L., … Chen, L. S. (2017). Effects of Low pH on Photosynthesis, Related Physiological Parameters, and Nutrient Profiles of Citrus. Frontiers in Plant Science, 8, 185. Fariduddin, Q., Hayat, S., Ahmad, A., 2003. Salicylic acid influences net photosynthetic rate, carboxylation efficiency, nitrate reductase activity and seed yield in Brassica juncea., Photosynthetica, 41, 281–284. |
|
De Villiers, A.J., I. Von Teichman, M.W. Van Rooyen and Theron G. K. 1995. Salinity-induced changes in anatomy, stomatal counts and photosynthetic rate of Atriplex semibaccata R. Br. S. Afr. J. Bot., 62, 270-276. |
Salinity |
Oliveira, J. G., Alves P. L. C. A, and Magalhães, A. C. 2002. The effect of chilling on the photosynthetic activity in coffee (Coffea arabica L.) young plants. The protective action of chloroplastid pigments. Braz. J. Plant Physiol., 14, 95-104. |
Caffeine |
Shettel, N., & Balke, N. (1983). Plant Growth Response to Several Allelopathic Chemicals. Weed Science, 31(3), 293-298. |
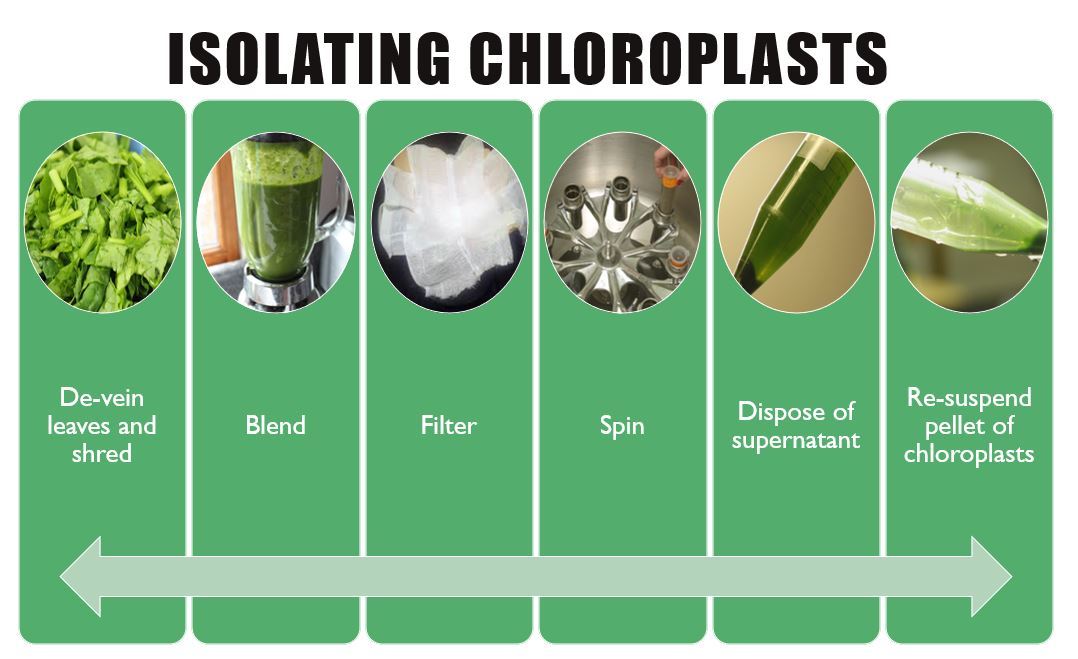
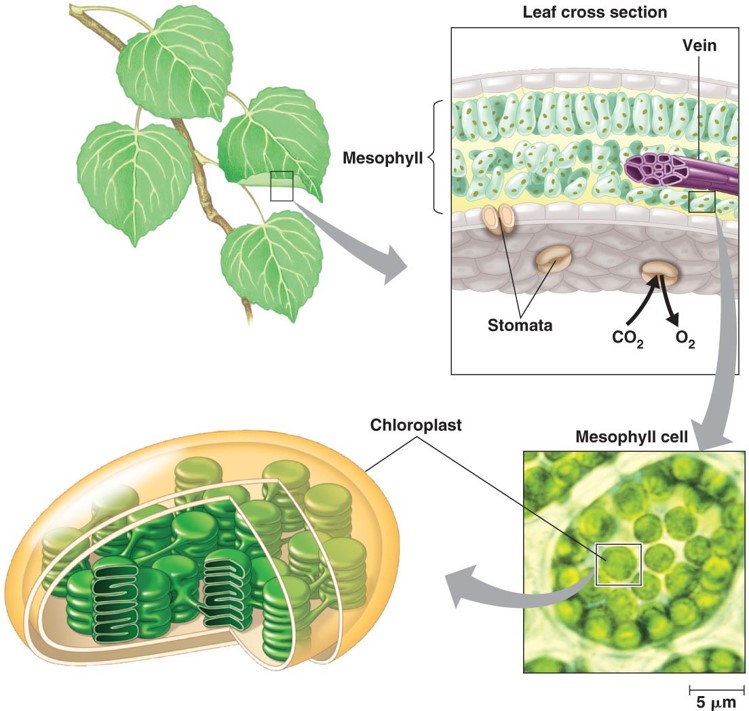
Chloroplast diagram. Click to enlarge.
Crayfish
Temp
Whitledge, G. W., and C. F. Rabeni. 2003. Maximum daily consumption and respiration rates at four temperatures for five species of crayfish from Missouri, U.S.A. (Decapoda, Orconectesspp.). Crustaceana, 75:1119–1132.
Size
Glazier, D. (2005). Beyond the ‘3/4-power law’: Variation in the intra- and interspecific scaling of metabolic rate in animals. Biological Reviews, 80(4), 611-662.
McFeeters, B. J., Xenopoulos, M. A., Spooner, D. E., Wagner, N. D., and Frost, D. P. 2011. Intraspecific mass-scaling of field metabolic rates of a freshwater crayfish varies with stream land cover. Ecosphere, 2(2), 13.
Glucose
Frank S. Corotto, Megan J. McKelvey, Elicia A. Parvin, Jessica L. Rogers, Jayme M. Williams, Behavioral Responses of the Crayfish Procambarus Clarkii to Single Chemosensory Stimuli, Journal of Crustacean Biology, Volume 27, Issue 1, 1 January 2007, Pages 24–29
Other Variables
Vaughan, R. A., Garcia-Smith, R., Bisoffi, M., Trujillo, K. A., & Conn, C. A. (2012). Effects of caffeine on metabolism and mitochondria. Nutrition and metabolic insights, 5, 59-70.
Romano, N. and C. Zeng. 2013. Toxic effects of ammonia, nitrite, and nitrate to decapod crustaceans: A review on factors influencing their toxicity, physiological consequences, and coping mechanisms. Rev. Fish. Sci., 21 (1), 1−21.
Dejours, P. and H. Beekenkamp. 1977. Crayfish respiration as a function of water oxygenation. Respiration Physiology, 30: 241-251.
Ellis, B. A. and S. Morris. 1995. Effects of extreme pH on the physiology of the Australian ‘yabby’ Cerax destructor: Acute and chronic changes in haemolymph oxygen levels, oxygen consumption and metabolite levels. Journal of Experimental Biology, 198: 409-417.
Water Quality & Management
Crayfish Taxonomy
|
Crayfish Natural History
|

Facts on KY Crayfish
|
Click to enlarge.
|
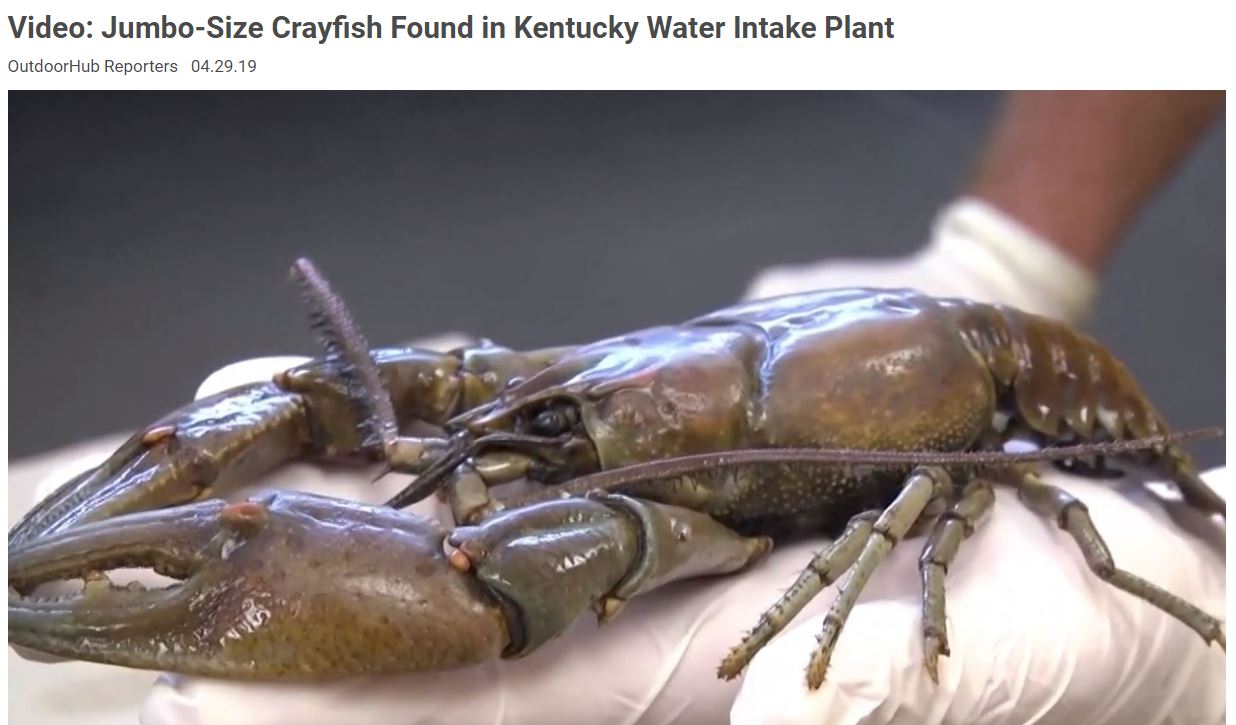
How big can they get? Check this out...our very own Dr. Huskey!
Diabetes
Osmosis & Diffusion
|
Facilitated Diffusion and Active Transport of Glucose Diabetes & Homeostasis |
Biochemistry |
Glycemic index of foods: a physiological basis for carbohydrate exchange, The American Journal of Clinical Nutrition, Volume 34, Issue 3, March 1981, Pages 362–366, Michelle Furtado, Romel Somwar, Gary Sweeney, Wenyan Niu, Amira Klip. Activation of the glucose transporter GLUT4 by insulin. Biochemistry and Cell Biology, 2002, 80 (5), 569-578. |
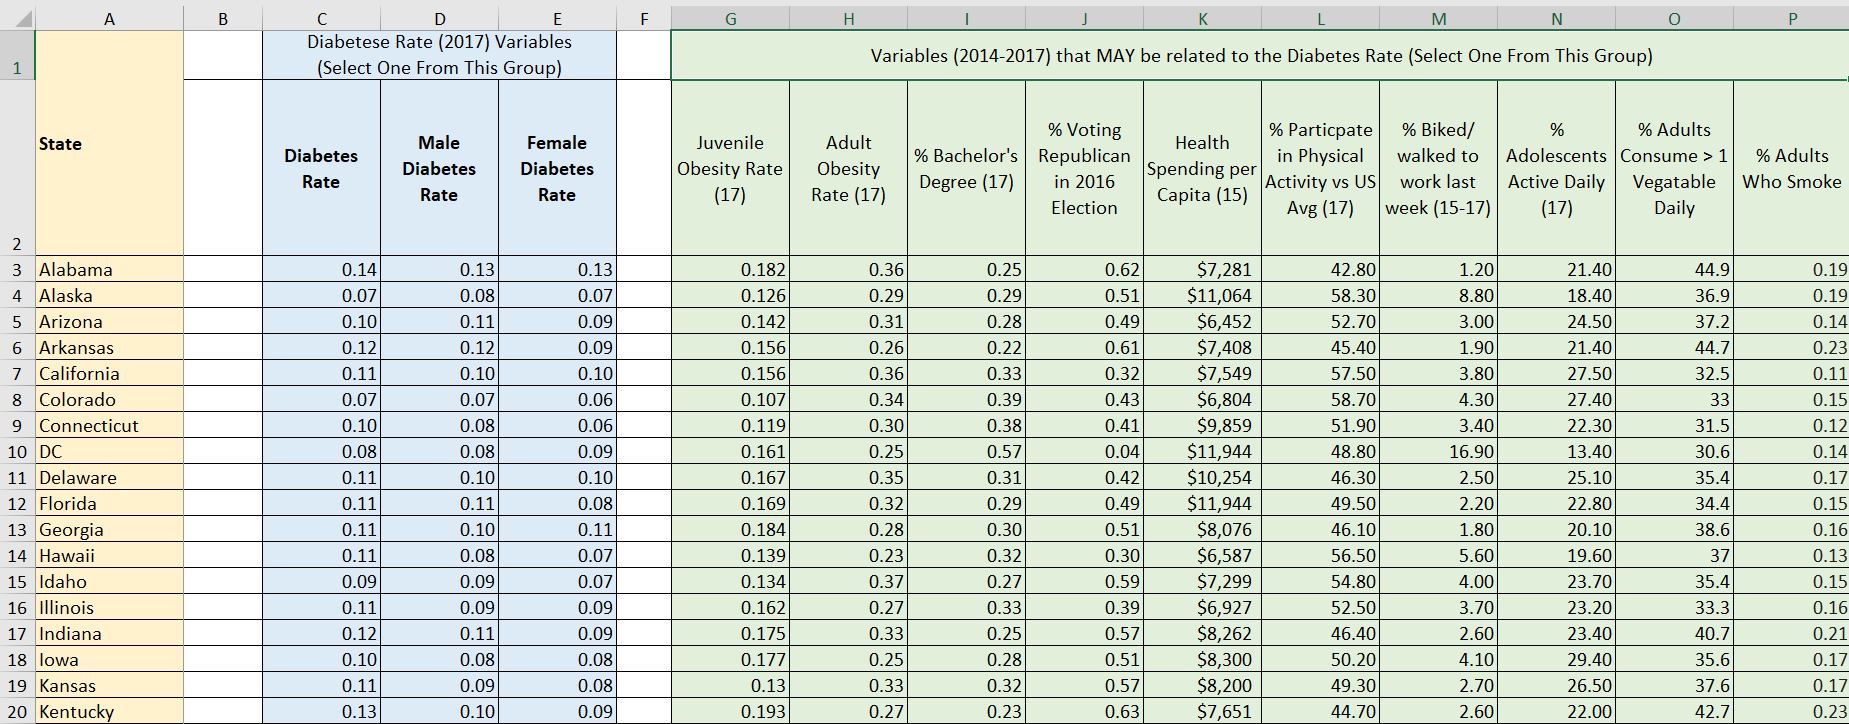
Diabetes dataset in Excel.
Click image to download.

Biochemical pathways of blood glucose homeostasis and feedback.
|

HBO documentary on the obesity and diabetes epidemic.
|
Diffusion & Osmosis
DNA Sequencing
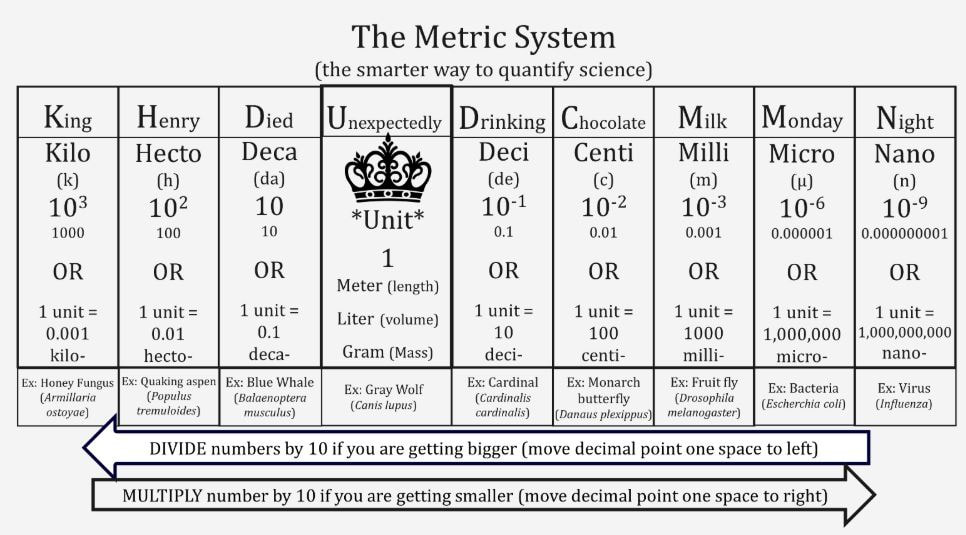
Metric System
The metric system is a standardized system of measurement used by scientists throughout the world. It is also the most common system of measurement used in most countries.... except the United States. Unlike the imperial system (IS) with which you are most familiar (inches, miles, gallons, etc.), the metric system is based on units of 10 and is thus much easier to use. The base metric units most commonly used in the biological sciences include:
- Meter – (m) – basic unit of length
- Liter – (L) – basic unit of volume
- Gram – (g) – basic unit of mass
- Degrees Celsius – (C) – basic unit of temperature
WHY DO SCIENTISTS USE THE METRIC SYSTEM?
- THE METRIC SYSTEM IS BASED ON UNITS OF 10 AND IS THUS MUCH EASIER TO USE. Conversion can be easily accomplished by multiplying or dividing by the conversion factor (103, 10-2, etc.) which entails simply moving the decimal to the right (to convert to smaller units) or to the left (to convert to larger units.
- SCIENCE IS INTERNATIONAL AND COLLABORATIVE. We must be able to discuss our methods and results across borders. Most of the world uses the metric system except for the US, Liberia and Myanmar.
- YOU CAN COVERT BETWEEN TYPES OF MEASUREMENT: FROM LENGTH TO VOLUME TO MASS: 1cm3 = 1mL = 1g One cubic centimeter corresponds to a volume of 1 / 1,000,000 of a cubic meter, or 1 / 1,000 of a litre, or one milliliter (1 cm3 ≡ 1 mL). The mass of one cubic centimeter of water at 3.98 °C (the temperature at which it attains its maximum density) is closely equal to one gram.
Photosynthesis
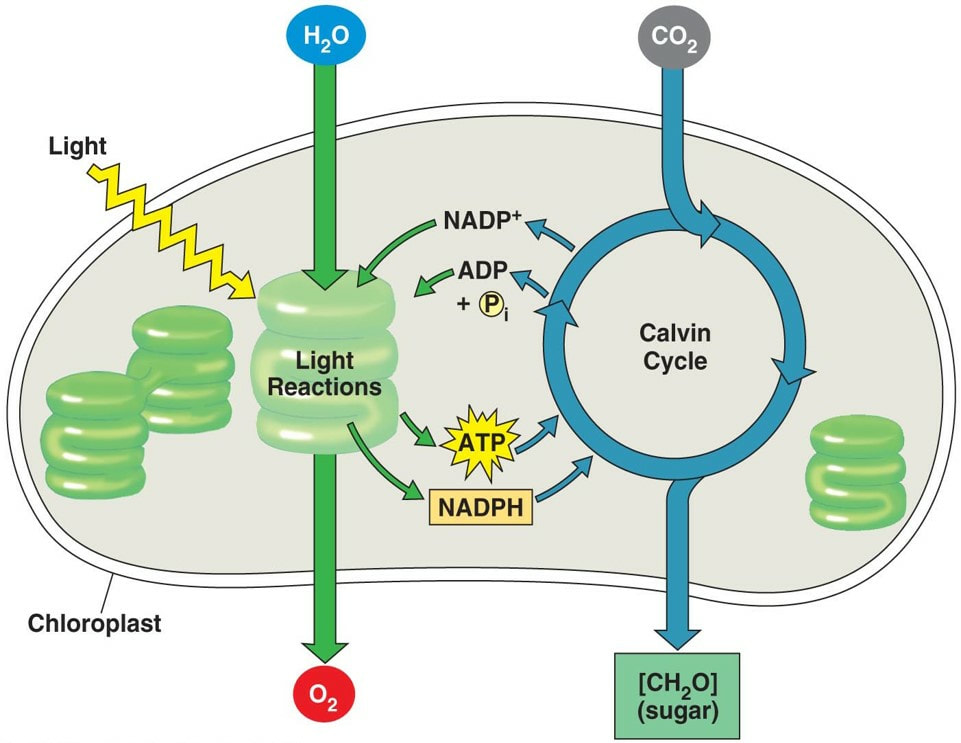
Click here for a review on photosynthesis.
|
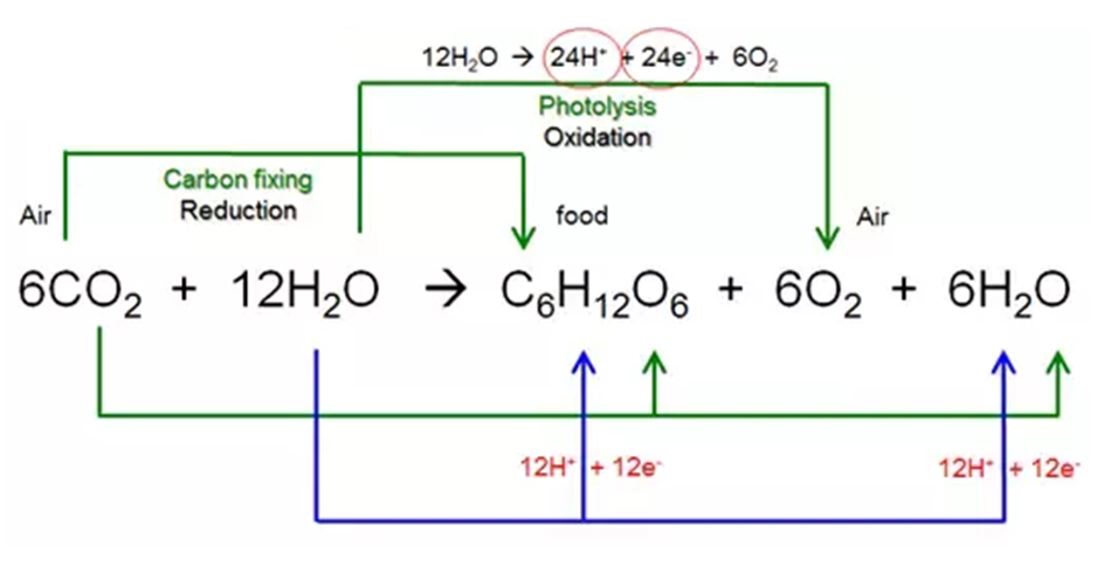
The complete photosynthesis reaction with redox labels. Click to enlarge.
|
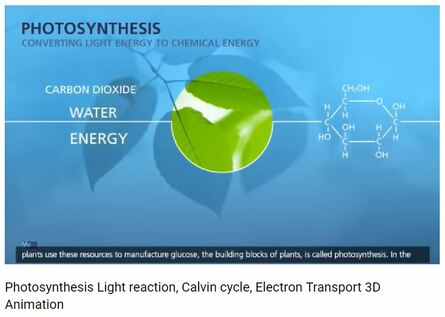
Nice YouTube video on photosynthesis
|
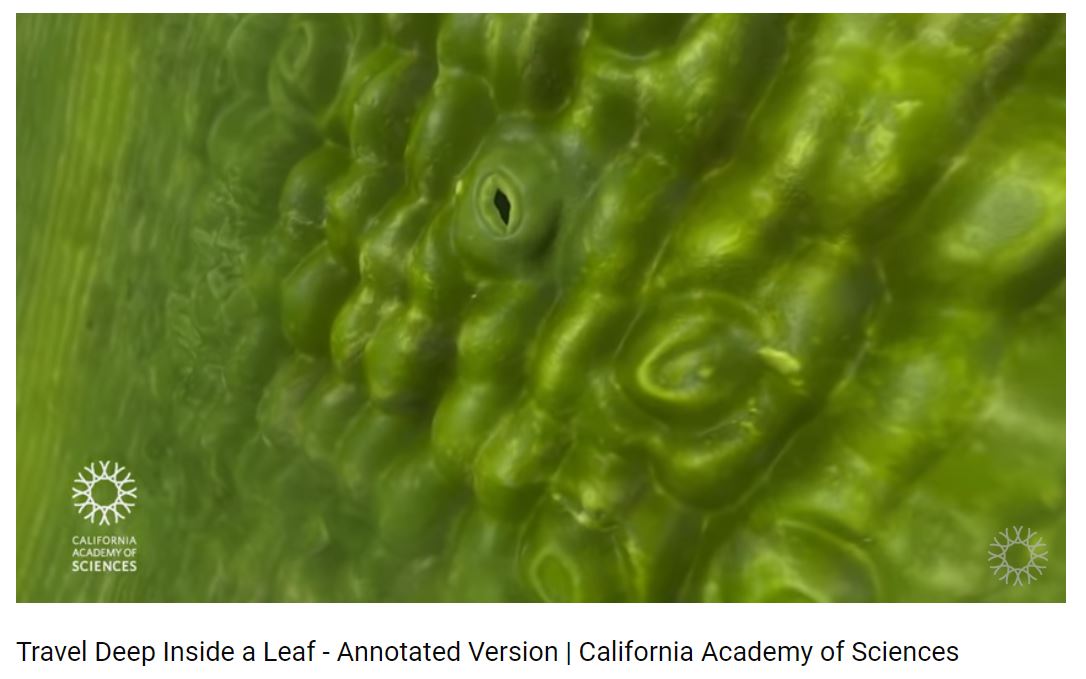
YouTube video takes you inside a leaf. Be sure to turn on the CC so you can read about each scene!
|
Polymerase chain reaction
|
Once DNA has been extracted, it is mixed into a particular PCR solution containing:
The PCR mixture is placed inside a thermocycler (PCR machine). It is typically repeated about 35 times and the temperature changes are programmed by researchers and automated by the thermocycler. The process proceeds in three steps as outlined below.
|

What is PCR? What kinds of questions can it help answer? Click to enlarge.
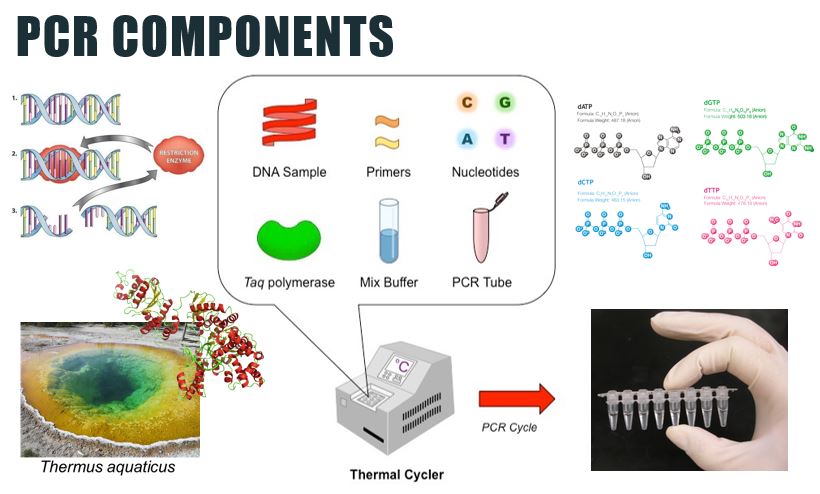
PCR components. Click to enlarge.
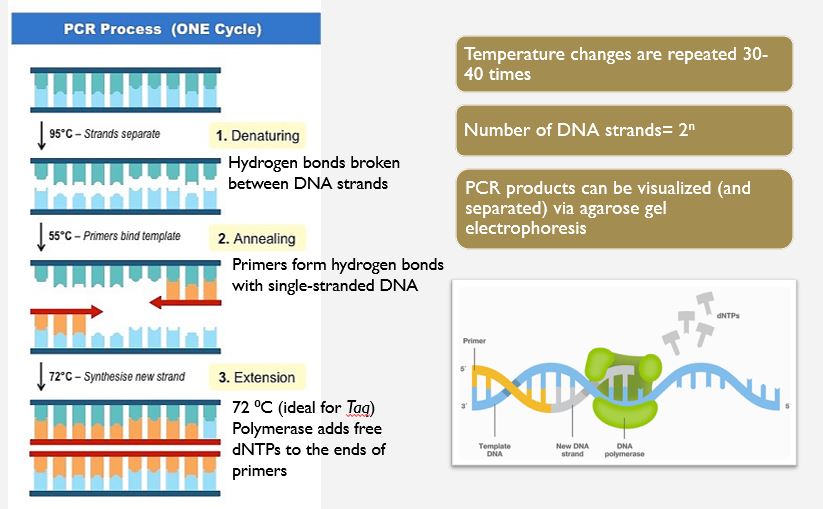
The 3 steps of PCR. Click to enlarge.
|
At the end of this first cycle, there are two DNA copies instead of the one original copy. The process continues, doubling the number of target DNA copies with each cycle. The general formula for the number of DNA strands created by PCR is X2^n where X = the number of original strands and n = the # of PCR cycles.
Statistics
Different is different...why do we need to run a t-test? A relationship is obvious...why do we need to run a correlation?
We look for patterns to help us understand the natural world. As we do so, we are fighting our own human tendency to see patterns where none truly exist, and to take what we see in a specific context and try to apply it more broadly.
|
Let’s say you notice that within your friend circle, those who regularly eat breakfast did much better on their first BIOL 120 exam than those who skipped your morning meals together. You might then assume that somehow, eating breakfast is causing the better grades. But! Consider the following...
Statistics solve this problem. Using the principles of probability, they help us parse what we observe from randomness (chance alone) vs. meaning (a real difference, or a real relationship). Statistics tell us how likely we would be to make the same observations we have made, if chance and randomness were the only drivers. If the probability is very low (<5%), we refer to these patterns as significant.

Comparing important concepts for each type of test. Click to enlarge. Review the statistics we will use and associated concepts in this table. Discuss the contents with your group and ensure everyone feels confident with material before moving on to the procedure.
|
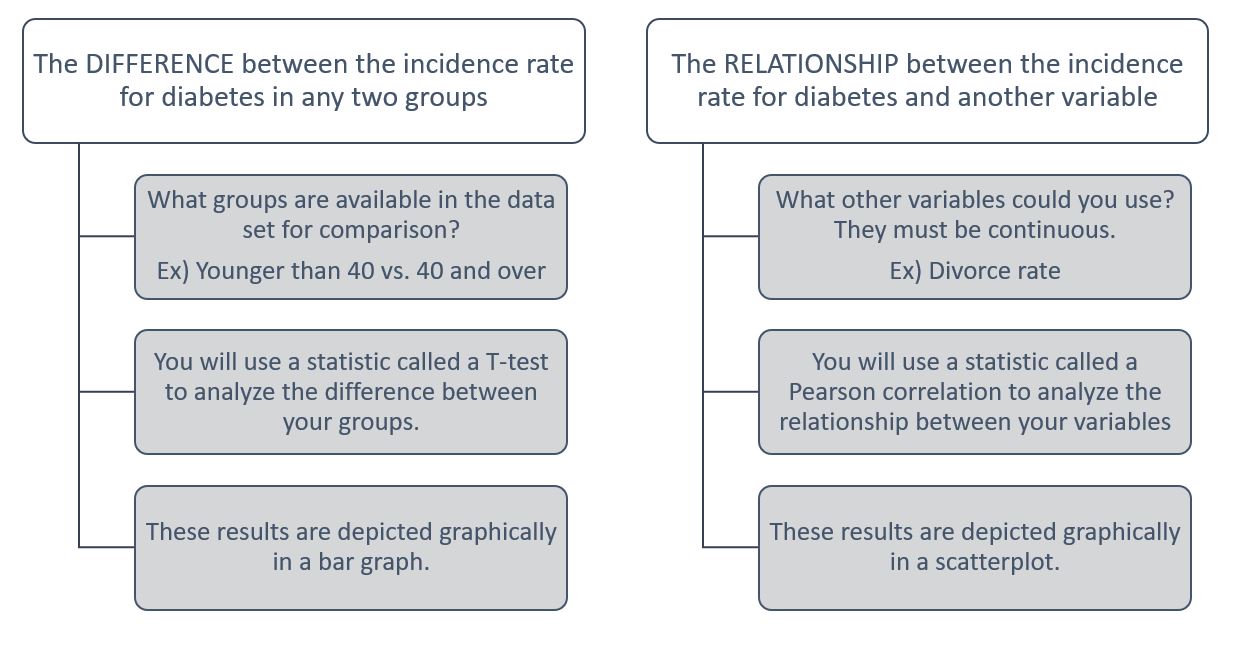
Research question examples and types of statistical tests. Click to enlarge.

T-test Online Calculator.

Pearson's Correlation Online Calculator.
|
Other FAQs in Statistics
TECHNIQUES & equipment
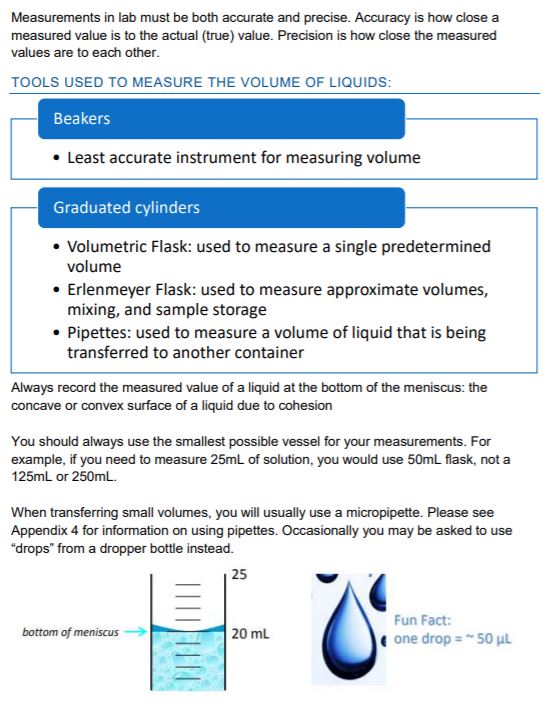
Equipment & Measurement
|
|
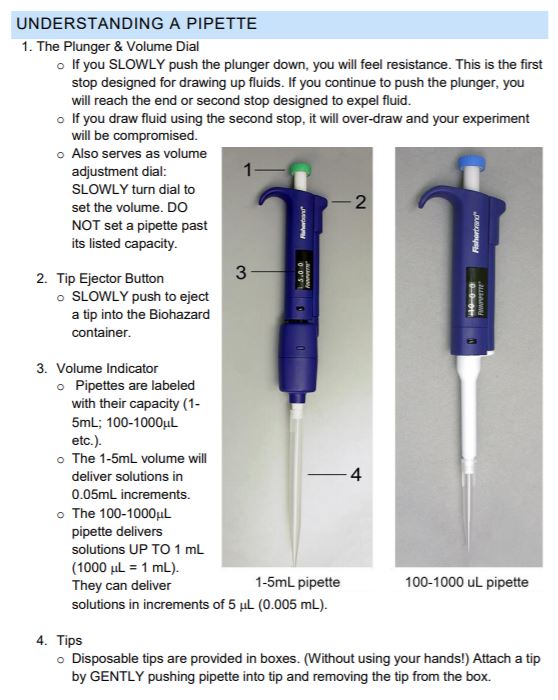
Using a Pipette
|
|
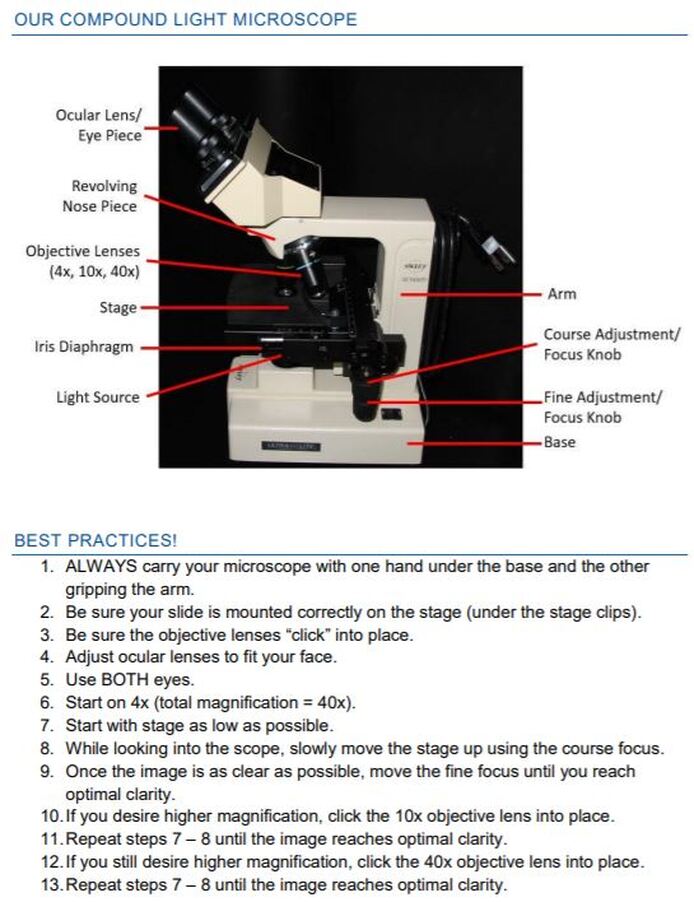
Microscopy
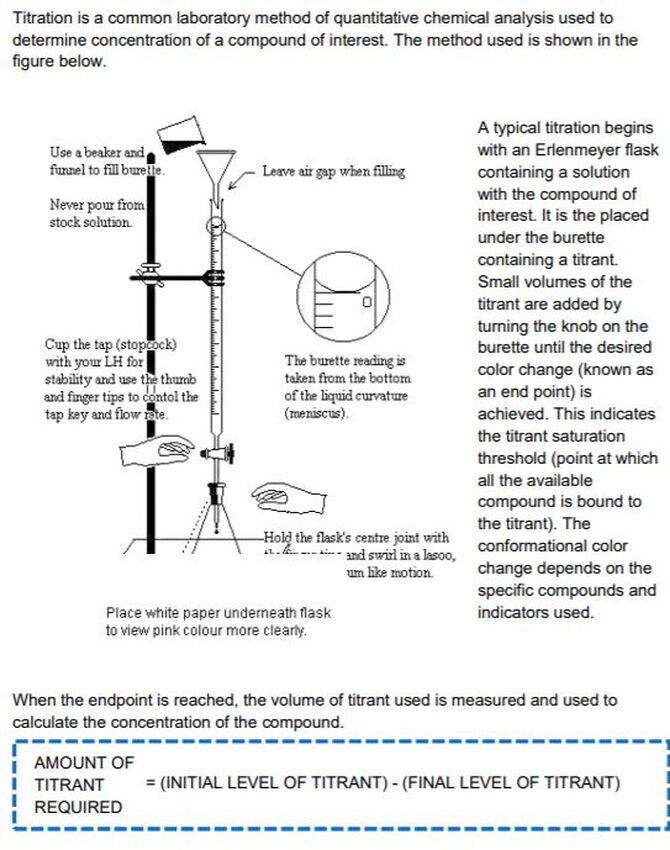
Titration
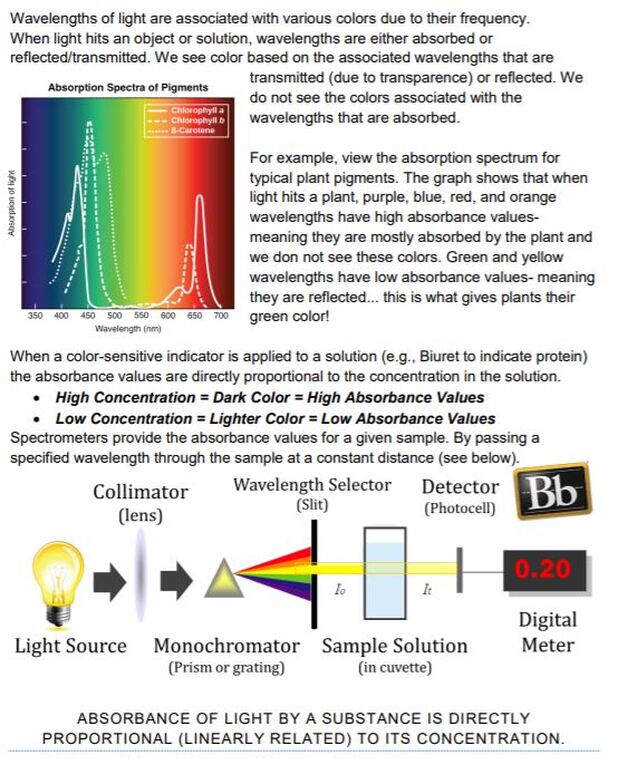
Spectrometer
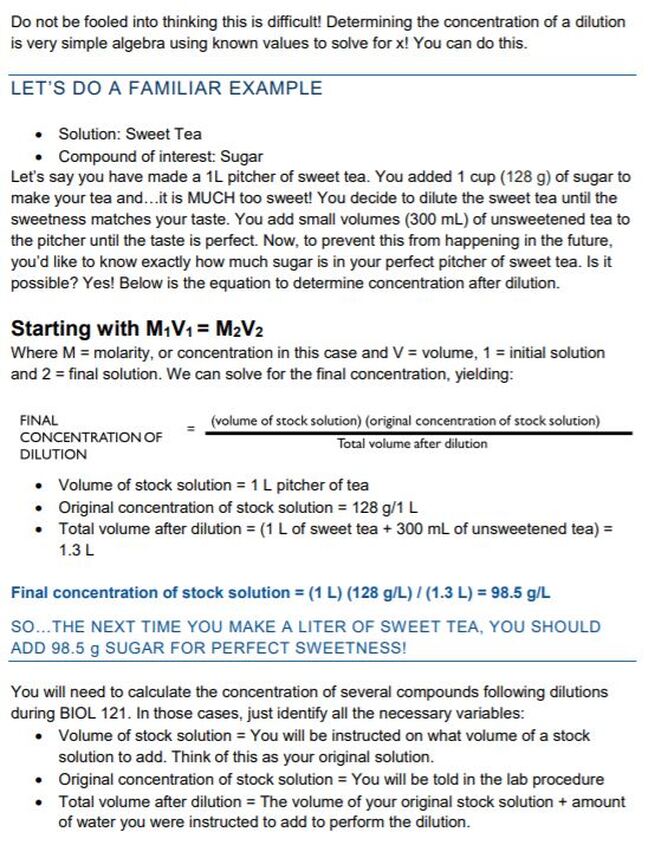
Dilutions
Citations
The proper citation for this manual is in the footer.
Generally APA citation style is preferred in the Biological Sciences.
Generally APA citation style is preferred in the Biological Sciences.
We often use the formatting guidelines from the Kentucky Academy of Science
IN-TEXT CITATION OF LITERATURE
Cite publications in the text by author(s) and date - e.g., (Readley 1985). For in-text references to works with one or two authors use names of both authors – e.g., (Jones and Williams 1991); for works with three or more authors use name of the first author followed by et al. – e.g., (Lee et al 1994); multiple citations should be in chronological order and separated by semi-colons – e.g., (Foster 1976; Ashley et al. 1987; Brown 1994); multiple citations of works by one author(s) should be in chronological order – e.g., (Jones 1978, 1983); publications by one author(s) in the same year should be distinguished by a, b, c, etc. – e.g., (Smith 1994a, 1994b).
LITERATURE CITED
List all authors of each entry.
Do not abbreviate journal titles.
The first line of each reference should be typed flush left; the remaining lines should be indented five spaces.
Examples of common types of references are given below.
JOURNAL ARTICLE:
Lacki, M. J. 1994. Metal concentrations in guano from a gray bat summer roost. Transactions Kentucky Academy Science 55:124-126.
BOOK:
Ware, M., and R. W. Tare. 1991. Plains life and love. Pioneer Press, Crete, WY.
PART OF A BOOK:
Kohn, J .R. 1993. Pinaceae, Pages 32-50 in J. F. Nadel (ed). Flora of the Black Mountains. University of Northwestern South Dakota Press, Utopia.
WORK IN PRESS:
Groves, S. J., I. V. Woodland, and G. H. Tobosa. In press, Deserts of Trans-Pecos Texas.
INTERNET:
Listing of web sites in the Literature Cited is not encouraged, but if it is needed, please follow the guide below.
Smith, A.W. 1999. Title of web site. Web site address. Date accessed (06/12/2005)
|
The Department of Biology at WKU strives to create a dynamic, experiential learning environment, and to be a destination department for competitive undergraduate and graduate students, involving them in the process of science and preparing them for success in a global society. This website is intended solely for use of BIOL 121 students. The information here is copyrighted or within "Fair Use" under the scholarship or education exemption.
|
|
KAS citation format:
Mountjoy, N.J 2021. Title of page. Biological Concepts: Cells, Metabolism & Genetics. https://www.121cellmetagen.com. Date accessed (MM/DD/YYY).
Mountjoy, N.J 2021. Title of page. Biological Concepts: Cells, Metabolism & Genetics. https://www.121cellmetagen.com. Date accessed (MM/DD/YYY).