Lab 7: Pre-Lab
Your task in Lab 7 is to carryout your experiment regarding the rate of cellular respiration and begin to analyze your data. To prepare for Lab 7, please review this pre-lab page. Once you feel confident regarding the below topics, complete the corresponding LABridge in Blackboard.
Cellular Respiration
CONNECTION ALERT! Cellular respiration is the topic of Chapter 9 in your BIOL 120 lecture. Please review your textbook as needed for this lab.
|
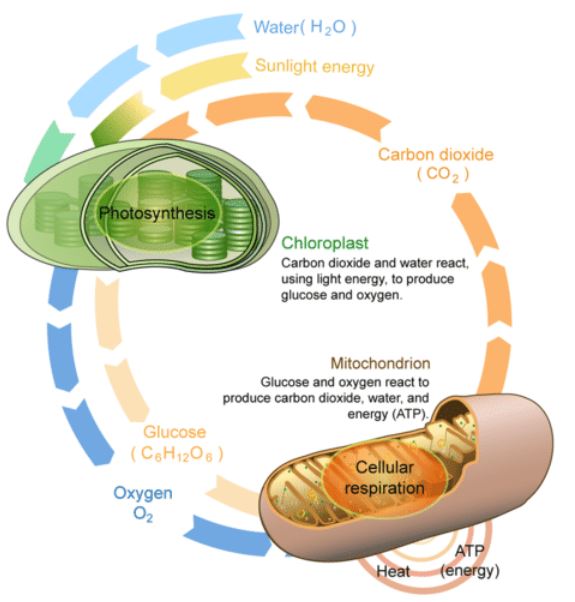
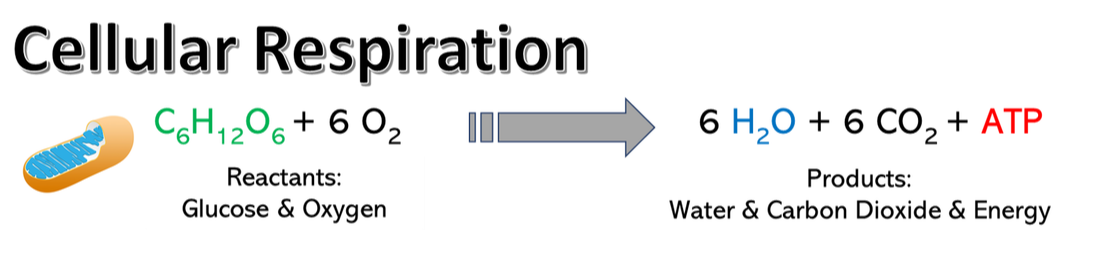
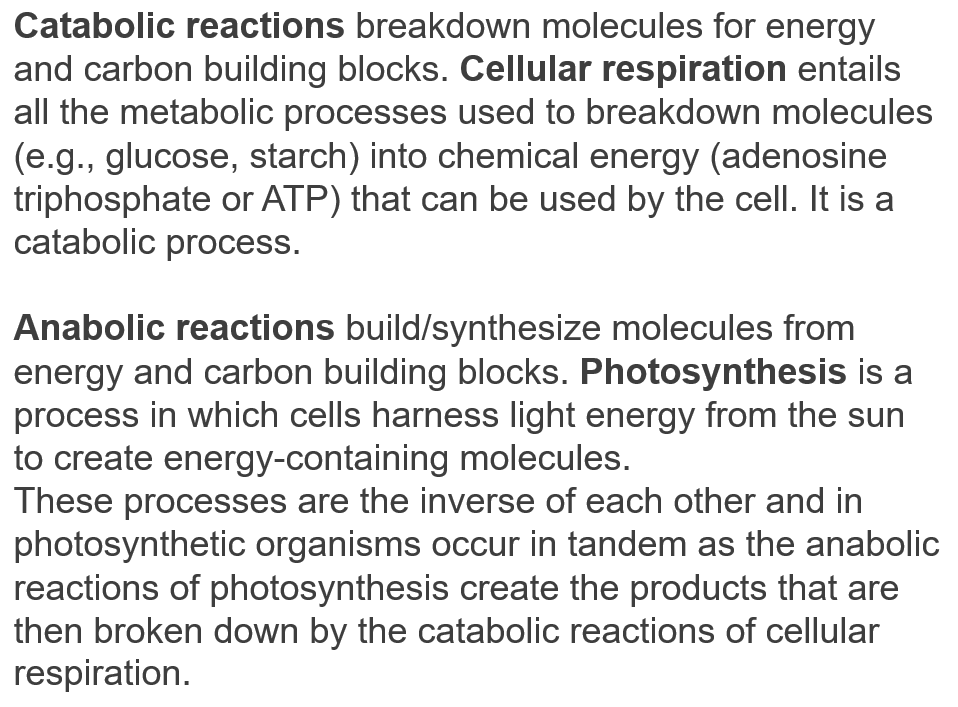
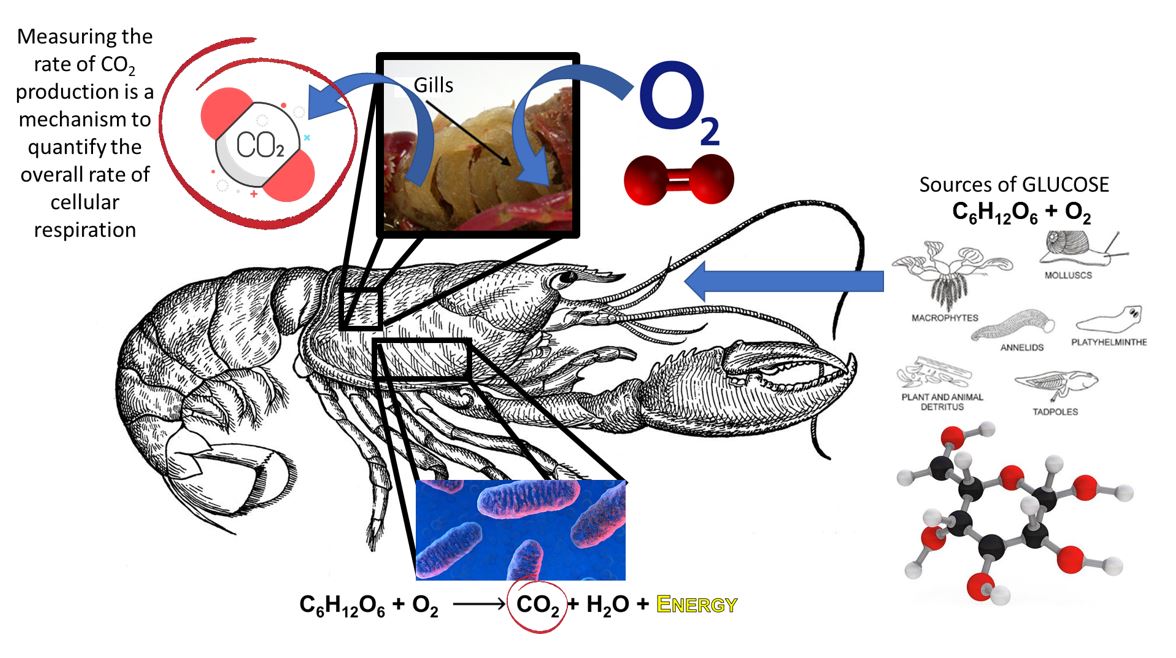
Energy is the currency of life: all living organisms require energy to survive and reproduce. Metabolism is the series of reactions and processes, catalyzed by enzymes, which together maintain life. These reactions fall into two types: catabolic or anabolic. These processes are the inverse of each other and in photosynthetic organisms occur in tandem as the anabolic reactions of photosynthesis create the products that are then broken down by the catabolic reactions of cellular respiration (view figure at left). There are two general classes of cellular respiration that are characterized by their relative efficiency (ATP production): anaerobic (without oxygen) and aerobic (oxygenated) respiration. We are focusing on aerobic respiration in this lab, which is a highly efficient process occurring within the mitochondria of eukaryotic organisms that have higher energy requirements for survival. In a 4 step process, oxygen and glucose are used to produce energy (ATP), H2O, and CO2, |
- Glycolysis ("splitting of sugar"): This step happens in the cytoplasm. One Glucose (C6H12O6) is broken down to 2 molecules of pyruvate. Requires 2 ATP to start, produces 4 with a 2 ATP net payoff.
- Pyruvate Grooming: The pyruvate from glycolysis is shuttled into the mitochondria, where it is converted to a molecule called Acetyl CoA for further breakdown.
- The Citric Acid Cycle: Occurs in the mitochondrial matrix. In the presence of oxygen (O2), all the hydrogens (H2) are stripped off the Acetyl CoA, two by two, to extract the electrons for making ATP, until there are no hydrogens left - and all that is left of the sugar is CO2 - a waste product - and H2O. The Citric Acid Cycle results in the production of only ~4 ATPs, but produces a lot of NADH, which will go on to the next step.
- The Electron Transport Chain and Chemiosmosis ("the big ATP payoff"). Occurs in the christae of the mirochondria, the folded membranes inside. Electrons from hydrogen are carried by NADH and passed down an electron transport chain. The energy release runs pumps that creat an electrochemical gradient of H+ ions. In Chemiosmosis, a big pump called ATP Synthase uses the gradient to produce A LOT of ATP. Results in the production of ~28-32 ATPs for every molecule of glucose.


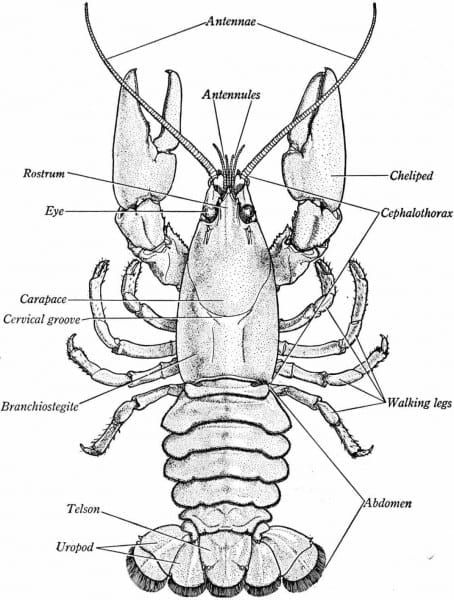
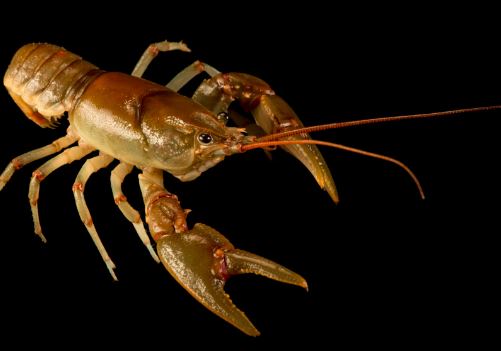
Do you know enough about crayfish?
Abundance. There are 640 species of freshwater crayfish (Order Decapoda) worldwide (Crandall and Buhay 2008). More than 360 species are in the US and the southeast is known as a hotspot of crayfish diversity (Taylor et al. 2007). Kentucky is inhabited by 54 species, with some under taxonomic review and others potentially awaiting discovery. Seven species are endemic to the state of Kentucky.
|
Status. Freshwater crayfish are valuable indicator species of watershed health. They act as "canaries in the coal mine" and provide early warnings of ecosystem distress when populations decline. Modification of habitats, sedimentation, and dams are serious threats to freshwater crayfishes. Nationally, about 48% of crayfish species are of conservation concern (ranging from Vulnerable to Endangered); over a third (37%) of the Kentucky fauna falls into this category (KSNPC, 2010). Cave species are particularly at-risk from upland activities that pollute groundwater flowing into cave systems; this includes issues with chemical spills, agricultural runoff, salt from roads, and siltation from poor land use.

Review the links in the sidebar: Facts on KY Crayfish and Crayfish Natural History. Also, watch the short video below to see these guys in action!

Review the links in the sidebar: Facts on KY Crayfish and Crayfish Natural History. Also, watch the short video below to see these guys in action!
|

Facts on KY Crayfish
Crayfish Natural History
|
What will we do in lab?
Your task was to design a proposal in Lab 6. In lab 7, we will conduct an experiment that tests the affects of one variable on the rate of cellular respiration in crayfish (AKA craw-fish or crawl-dad). Like most animals, they rely on aerobic cellular respiration to meet their energy demands.

Review the general procedural steps we will use below. Your exact methods will differ depending on which variable you have selected to test. Make sure you are comfortable with concepts below.
|

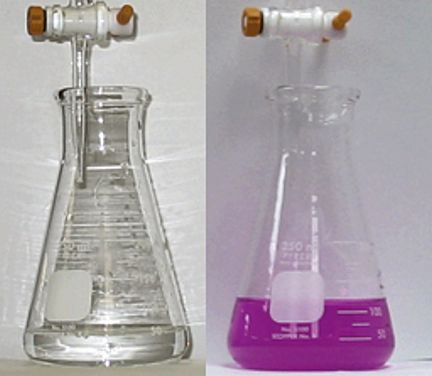
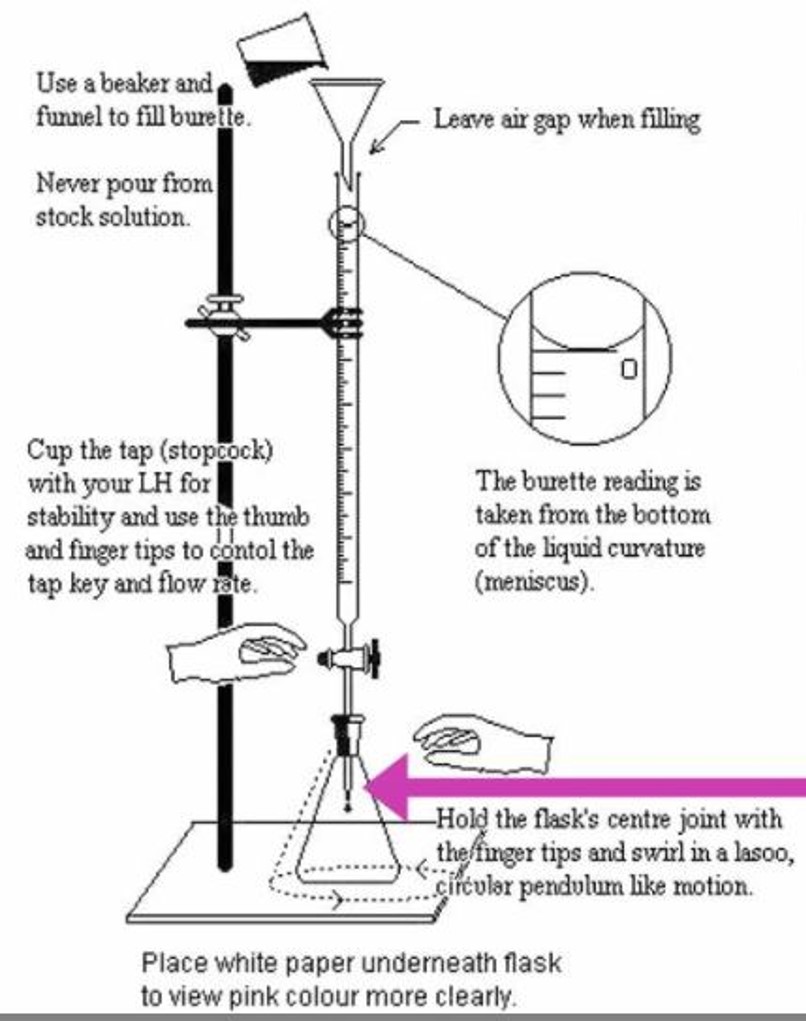
Review the YouTube video below on titration with phenollphthalein so you have a good idea of what to expect in lab! 
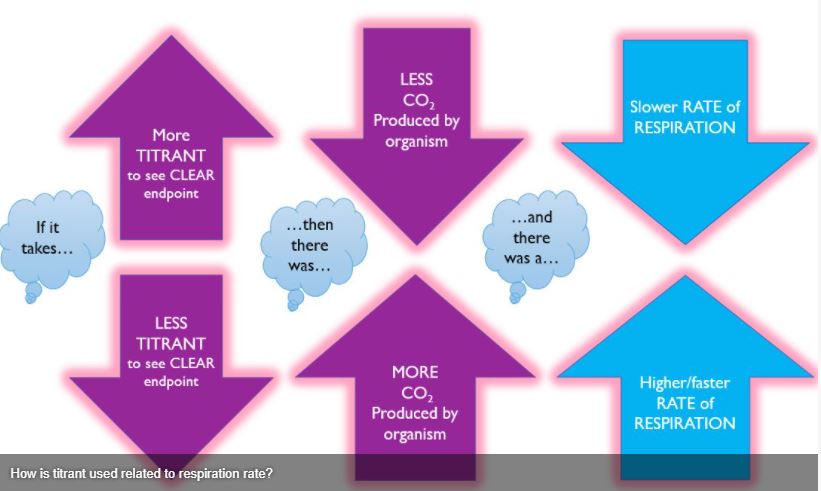
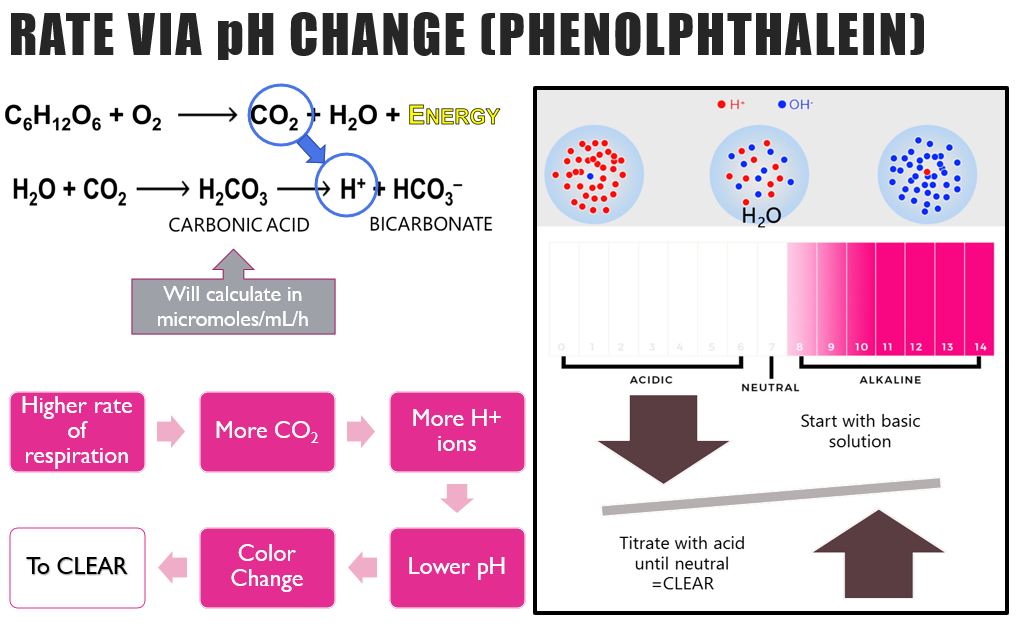
How pH change indicates respiration rate. Click to enlarge.
Special Note! You have no doubt noticed the importance of sample size for this experiment to work well. Depending on your lab size, timing, and proposals, you may be asked to share data as a class or among several groups testing the same variables. You may also be asked to pick just one variable and all test it together as a class. |

Be sure you understand the relationship between the amount of titrant required and the rate of cellular respiration.

Click here to get to WKU's blackboard to take your LABridge for this week. Be sure your Notebook Entry from last lab is ready to submit!
Lab 7: ProtocolIn today's lab you will work with your lab group to conduct your experiment and begin to analyze your data.
Exercise I. Review your research proposal and the pre-lab and revise where necessary Exercise II. Conduct your experiment & collect data Exercise III. Analyze your data |
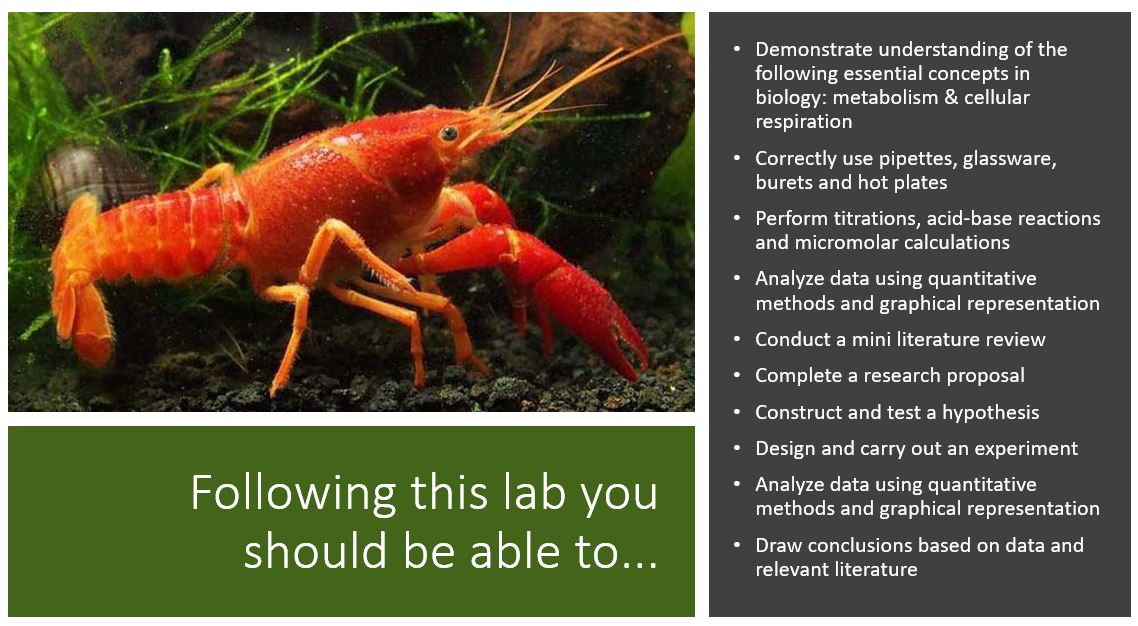
Lab Objectives: Following today's lab, you should be able to...
|
Exercise I. Prepare
|
Procedure.
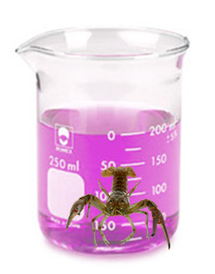
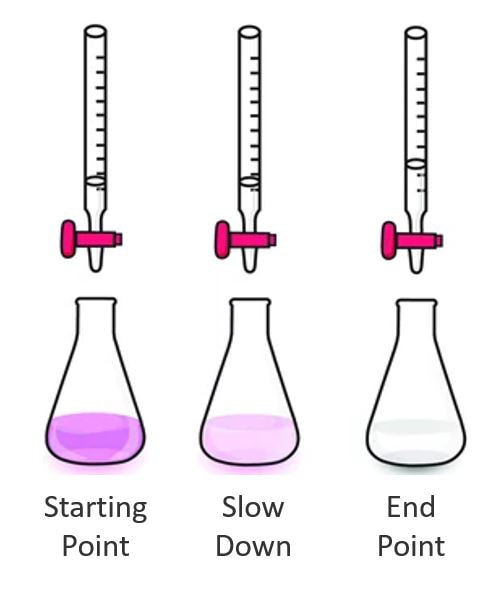
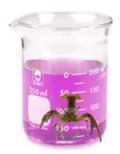
Remember: Basic solutions are pink with the phenolphthalein indicator and acidic solutions are clear. The crayfish will expel CO2, making the solution more acidic and closer to "clear."
|

Lab 7 Notebook Guide. Click to download.

Takes pics for your poster!
|
Exercise II. Run your experiment & collect data
With an understanding of cellular respiration and how the phenolphthalein indicator works, we should be able to determine the rate of respiration of our crayfish in different conditions. You will complete 3 titrations/tests today in lab:
- Baseline: This test will establish how much titrant is required to reach our endpoint (from pink to clear) without a crayfish. The value you are aiming for will be written on the board (Nb)
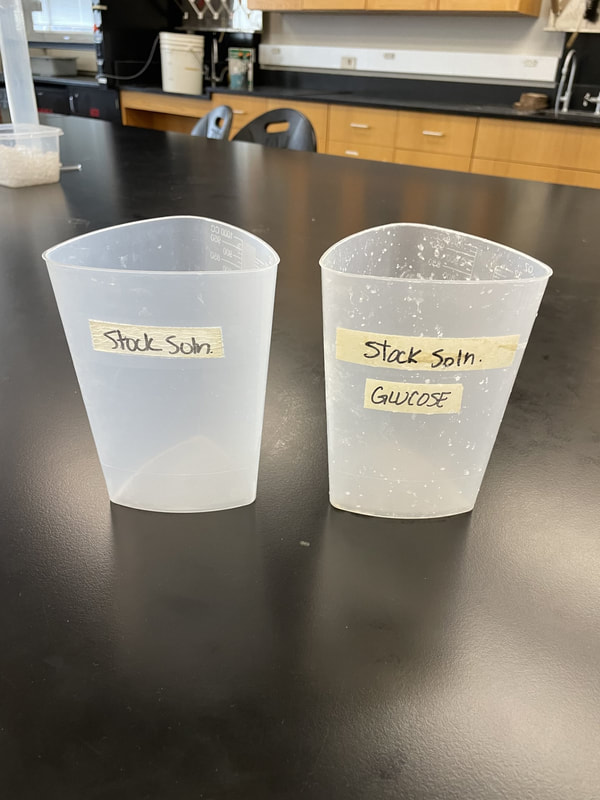
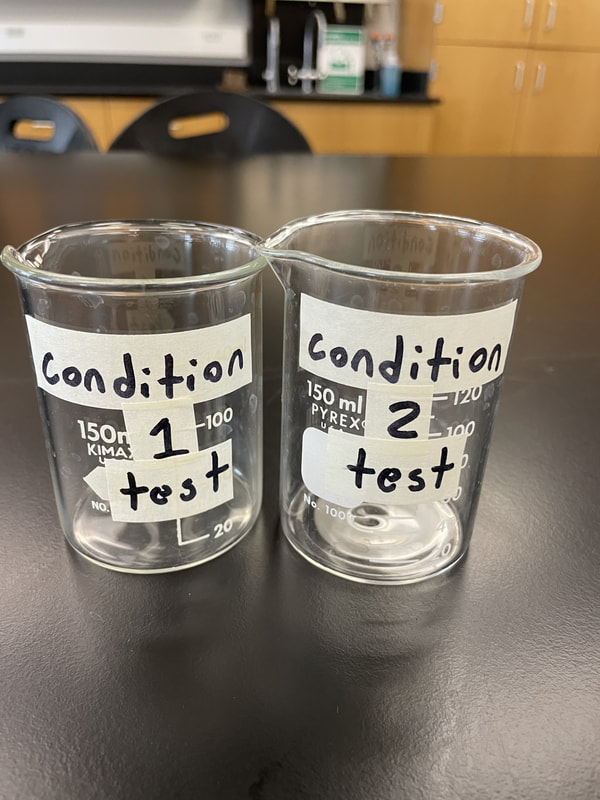
- Experimental Control: Conduct your experimental control (condition 1) with a crayfish in a phenolphthalein solution WITHOUT Glucose/ ROOM Temperature (Ne).
- Experimental Treatment: Conduct your experimental treatment (condition 2) with a crayfish in a phenolphthalein solution WITH glucose, or in a COLD solution (Ne).
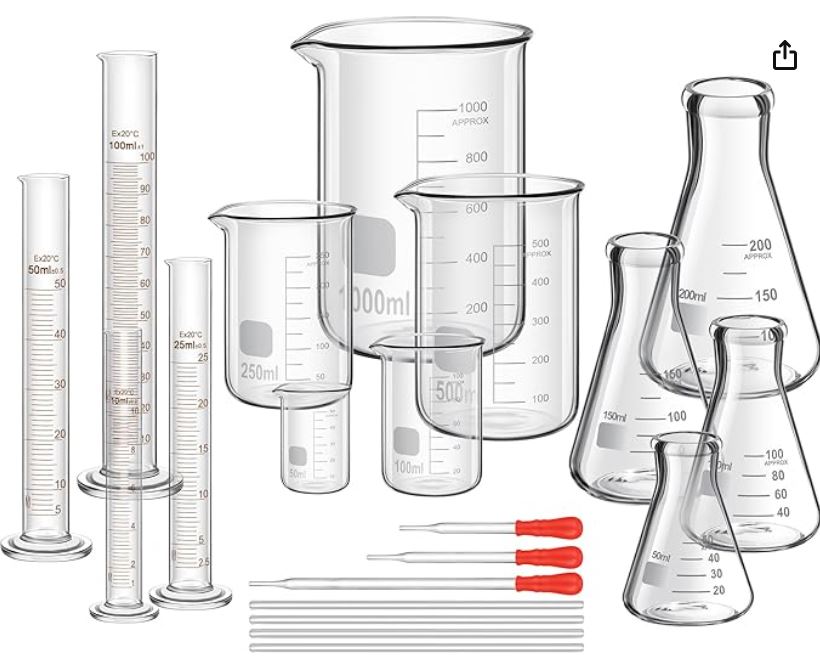
Materials.
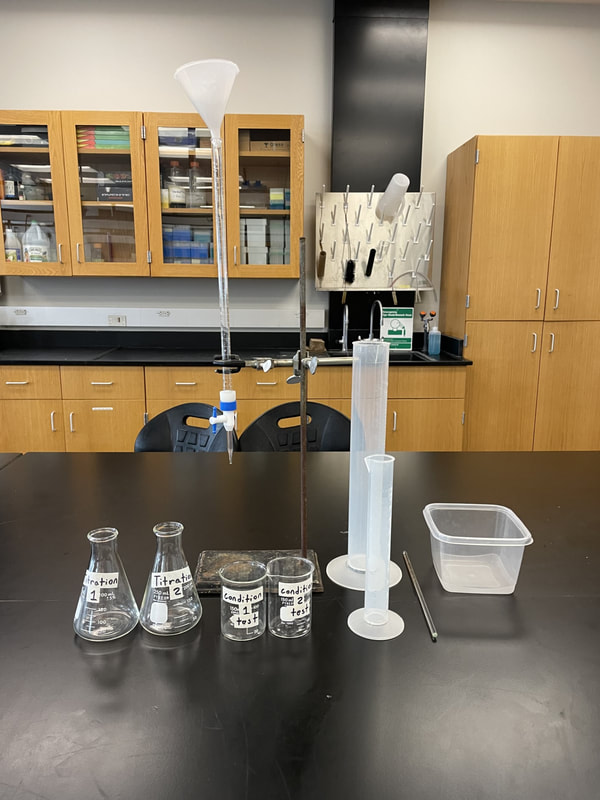
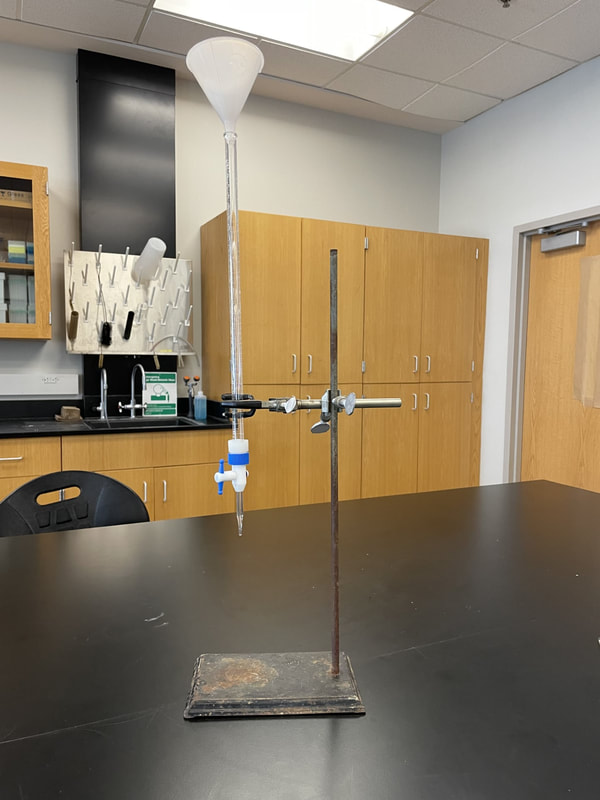
Procedure.
For the purposes of time, you will start with your experimental control (condition 1), then practice your titrations and establish a baseline, then do your experimental treatment (condition 2). Lastly, you will do some calculations. This protocol has been separated into four parts (A-D). Be sure to follow the directions closely as we move from one section to another to take advantage of your wait times. *Items in pink below can vary based on the size of our crayfish each term and will be provided by the TA.
A) Experimental Control (condition 1) "WITHOUT Glucose" / "ROOM Temperature" with Crayfish (Ne)
|
Procedure. Set-up and begin condition 1, your experimental control.
|
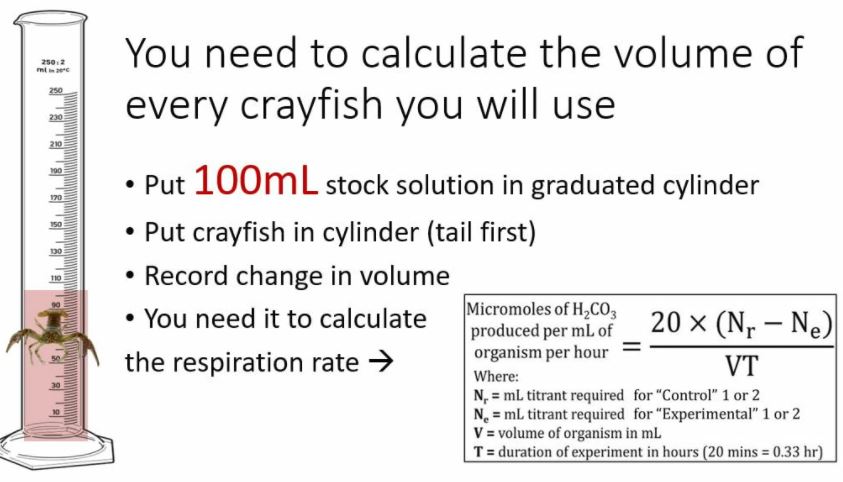
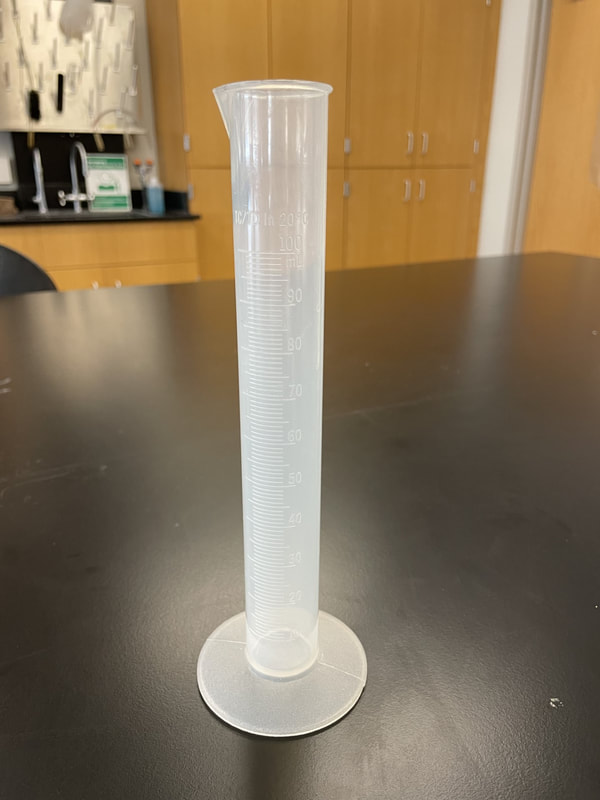
How to determine crayfish volume. Click to enlarge.
Lab 7 data collection excel sheet. Click to download.

What to look for.
|
B) Practice Titration & Establish a Baseline Without Crayfish (Nb)
Procedure. While waiting for your crayfish to respire, you will practice titration and establish a baseline (without crayfish).
- Practice using the burette. Place either flask underneath and play with the tap. Vertical = completely open. Horizontal = completely closed. Find the position that allows for a steady drip of the titrant.
- Once you feel confident, ask your TA to place your used titrant back into the burette.
- Before you titrate for the baseline, place a white index card under the flask to help you see the color change better.
- You are working to slowly remove the pink color. As the color lightens, you should start to slow. Only when the pink is gone, and stays gone, have you reached the endpoint.
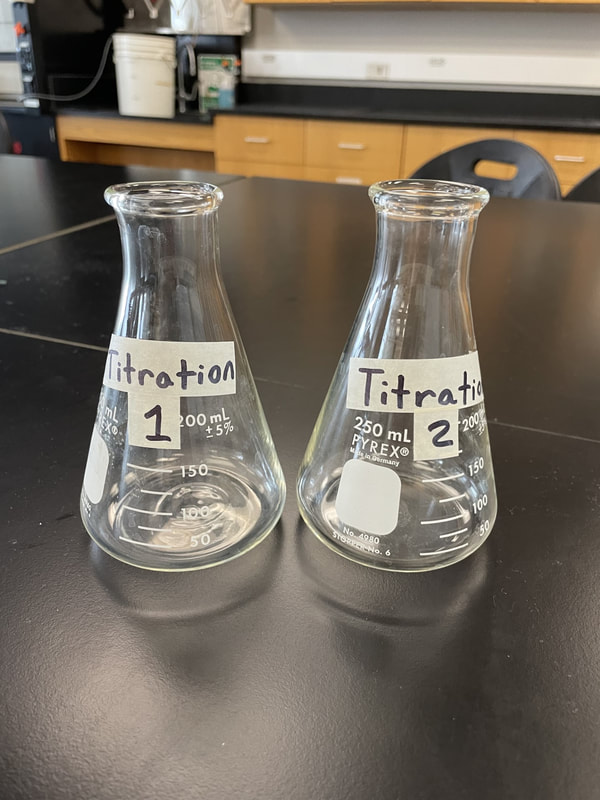
- Place 50mLs of the stock solution (from your pitcher) into a flask (either one is fine).
- Record the starting volume of your burette.
- Titrate slowly and steadily until you reach a clear endpoint. Your values should come close to those on the board.
- Complete your acid-base titration to clear endpoint.
- Record the ending volume of your burette.
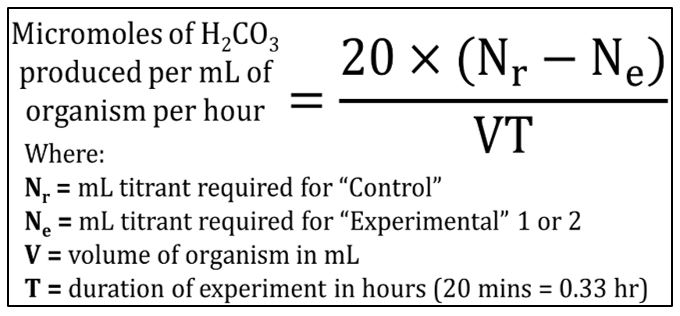
- Calculate the amount of titrant you used to reach the clear endpoint. This is your baseline (Nb). You will use it to calculate the umols of CO2 released by your crayfish in your two test conditions.
- Go into your data collection excel sheet and label your two conditions properly, in the first cell of each column.
- Record this value as the baseline (Nb) for each condition in your data table.
- Rinse your used flask. You may need your TA to top-off your burette. Return to Part A, #15.
Click to enlarge.
|
What to look for.
|
C) Experimental Treatment (condition 2) "WITH Glucose" OR "COLD Temp" (Ne)
|
Obtain the appropriate treatment solution depending on your test.
|
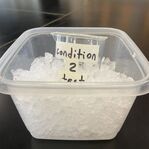
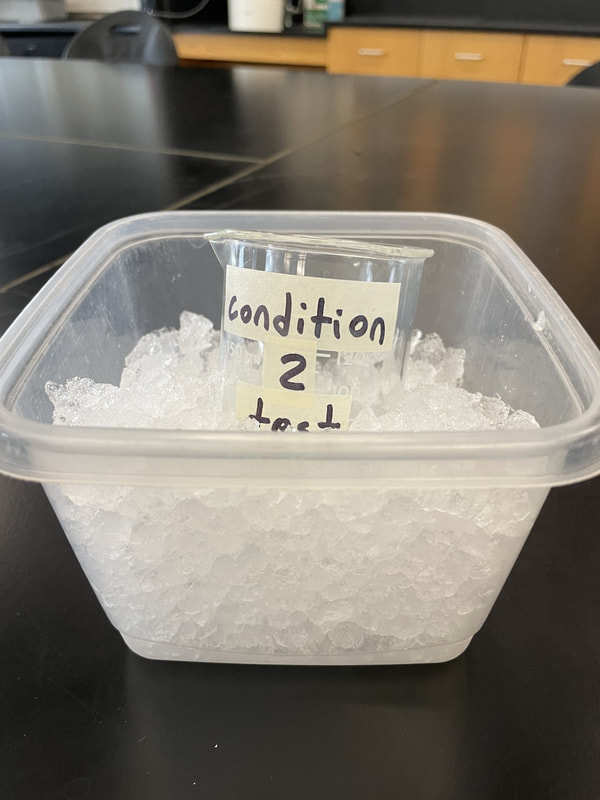
Ice Bath Set-Up if testing temperature.
|
Procedure. Set-up and begin condition 2, your experimental treatment condition.
- Obtain your crayfish. Determine and record its' volume using the same protocol in part A (#4-9). Transfer the solution and crayfish (gently) into your test beaker as you did before.
- You may need to add more solution to the beaker to ensure the crayfish stays submerged. This depends on the size of your crayfish and the level will be provided by your TA.
- Set your time and begin the test. Your crayfish will be allowed to respire into this beaker for 20m (0.33h) or 30m (0.5h). Check your TA.
- While you wait: Move on to part D. Complete the calculations for your control condition 1...
- ...After your allotted time is complete, remove your crayfish from the test beaker and place it (gently) in the recovery tank on the front desk.
- You will use 50 mL of your control or experimental solution for the titration. Carefully transfer 50mLs into your condition 1 flask.
- Record the starting volume of your burette.
- Complete your acid-base titration to clear endpoint.
- Record the ending volume of your burette.
- Calculate the amount of titrant required for condition 2. Record it as the Ne for condition 2 and complete the data table.
- Complete Part E for your second condition.
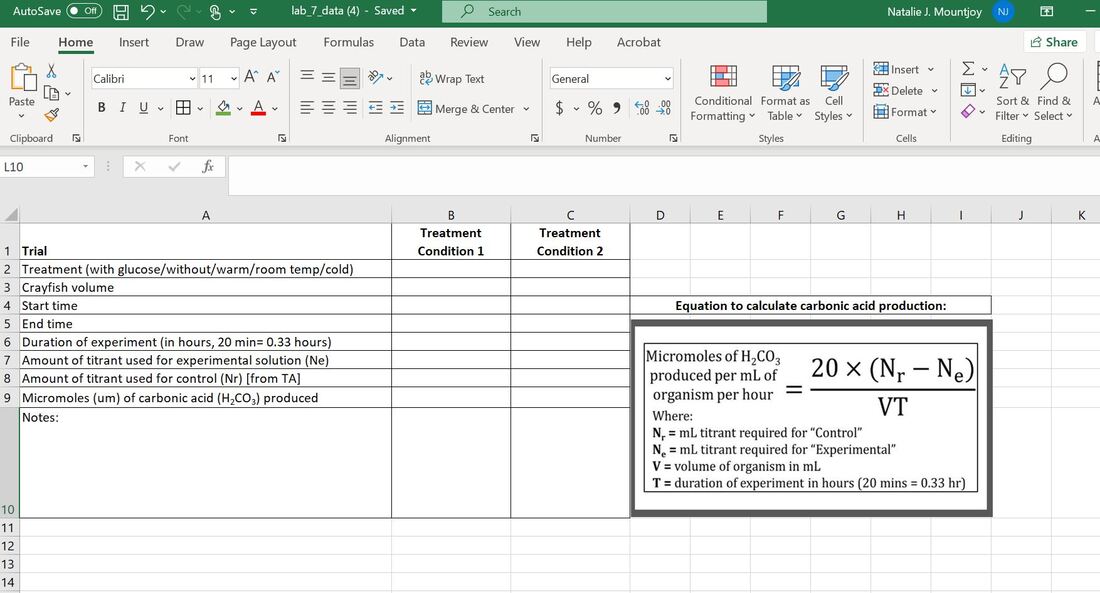
D) Calculate the Carbonic Acid (umols) Produced by your Crayfish
|
Procedure.
|

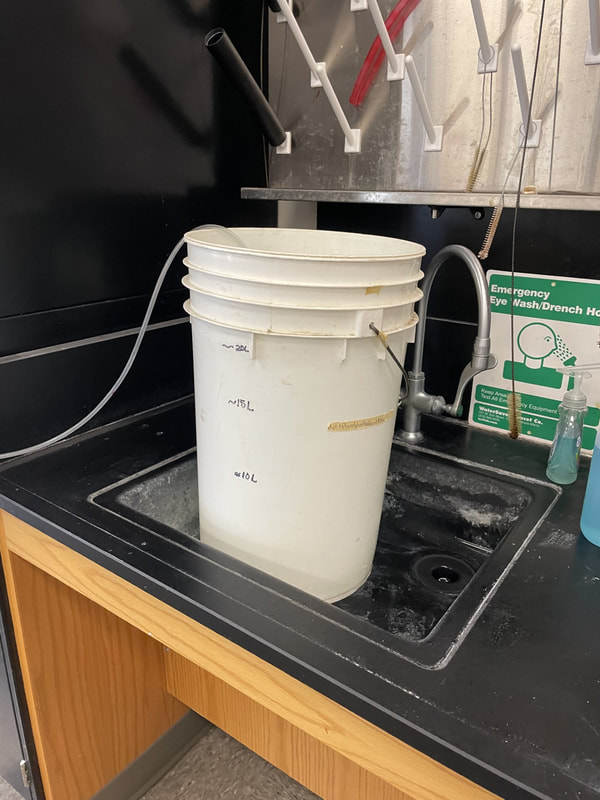
Clean your station before checking out. Leftover titrant stays in the burette and all other solutions can go down the drain.
|
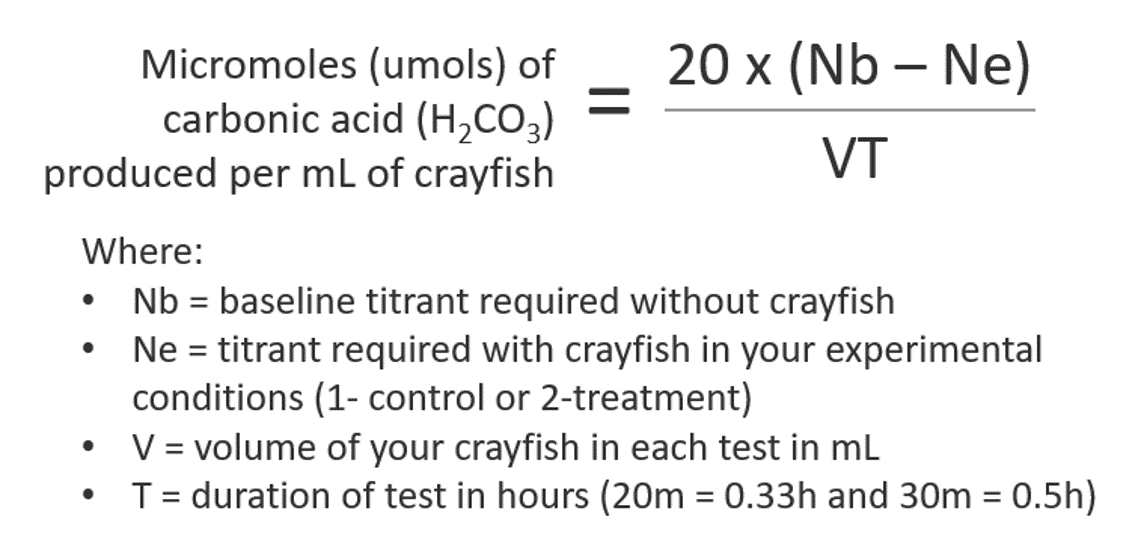
Be certain you are using the correct variables and correct units.
|
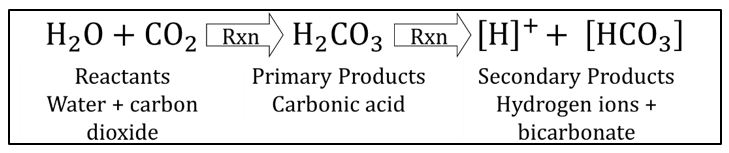
REMEMBER why we have to use titration! In an aqueous environment, CO2 combines with water to first create carbonic acid, which is then broken down into hydrogen ions. The addition of H+ ions results in a change in pH: the pH decreases and becomes more acidic. The introduction of CO2 from the crayfish would have lowered the pH some, but not enough in 20 minutes to make it acidic enough to turn clear. The CO2 released is transformed to carbonic acid which we can measure with this equation.
|
Exercise III. Analysis
Comparing the single data points you have is an OK way to test for differences in respiration rate. But, ideally we would have a larger sample size (using class data) and statistics. Now, what type of statistics should we use to determine if the mean respiration rate between our 2 groups is significantly different? ...hopefully this is an easy answer. A T-test! We need to determine if the mean umols carbonic acid (H2CO3) produced in your two conditions are close enough to be the same or far enough a part to be different.
Remember: Statistics solve the problem of determining if "more" or "higher" or "different" than is actually enough to be important and biological relevant. Using the principles of probability, they help us parse what we observe from randomness (chance alone) as meaning (a real difference, or a real relationship). Statistics tell us how likely we would be to make the same observations we have made, if chance and randomness were the only drivers. If the probability is very low (<5%), we refer to these patterns as significant.
|
Procedure.
Comparing the single data points you have is an OK way to test for differences in respiration rate. But, ideally we would have a larger sample size (using class data) and statistics. Now, what type of statistics should we use to determine if the mean respiration rate between our 2 groups is significantly different? ...hopefully this is an easy answer. A T-test! We need to determine if the mean umols carbonic acid (H2CO3) produced in your two conditions are close enough to be the same or far enough a part to be different.
|

Visit the stats section of our research library.

T-test Online Calculator.
|
To pair or not to pair?
Ideally, we would run these experiments as paired tests and use the same crayfish in each experimental condition (control vs. treatment). However, this would require a prolonged resting period for the test crayfish for high survivability and non-biased results in the second test. For this reason we usually use a non-paired test. Chat with your TA about this if you have questions.
Ideally, we would run these experiments as paired tests and use the same crayfish in each experimental condition (control vs. treatment). However, this would require a prolonged resting period for the test crayfish for high survivability and non-biased results in the second test. For this reason we usually use a non-paired test. Chat with your TA about this if you have questions.
|
Lab 7 BIOL 120 CONNECTIONS Section 1.6: Doing Biology Big Picture 1: How to Think Like a Scientist BioSkillls 2: Reading & Making Graphs BioSkillls 3: Interpreting Standard Error and Using Statistical Tests BioSkillls 4: Working with Probabilities Chapter 9: Cellular Respiration |
Faculty Spotlight: Dr. Noah Ashley
We are conducting experiments to identify factors that affect the physiological process of cellular respiration in crayfish. Similarly, Dr. Noah Ashley's lab works to identify physiological, immunological, and behavioral responses to various factors, like sickness and sleep loss, in mice and birds. Specifically, they are investigating the costs and benefits of the sickness response in vertebrates, the inflammatory response in sleep-deprived mice, sleep loss in migratory birds, and the sleep-wake cycle in arctic songbirds. Dr. Ashley's lab is extremely productive! His research proposals have been funded by the NSF and the NIH. Learn more here (Lab Web Page). You just might recognize one of his current graduate students! |

|
The Department of Biology at WKU strives to create a dynamic, experiential learning environment, and to be a destination department for competitive undergraduate and graduate students, involving them in the process of science and preparing them for success in a global society. This website is intended solely for use of BIOL 121 students. The information here is copyrighted or within "Fair Use" under the scholarship or education exemption.
|
|
KAS citation format:
Mountjoy, N.J 2021. Title of page. Biological Concepts: Cells, Metabolism & Genetics. https://www.121cellmetagen.com. Date accessed (MM/DD/YYY).
Mountjoy, N.J 2021. Title of page. Biological Concepts: Cells, Metabolism & Genetics. https://www.121cellmetagen.com. Date accessed (MM/DD/YYY).