Lab 1: Pre-Lab
Your task in Lab 1 will be to construct a research proposal using the scientific method and a provided diabetes data set. The proposal you will create will be the basis for your technical report due at the end of the unit. To prepare for Lab 1, please review the pre-lab section of this page. Once you feel confident regarding the below topics, complete the corresponding LABridge in Blackboard.
Introduction to The Scientific Method & Research Proposals
Scientists must often apply to have their research projects funded from governmental or non-governmental agencies, like the National Science Foundation or National Institutes of Health. A research proposal is simply a plan for research to be conducted. There are four primary characteristics that a quality proposal must address:
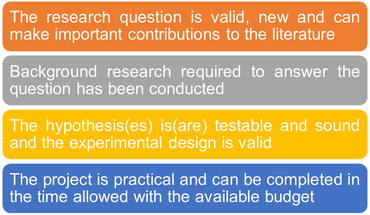
Requirements of a quality research roposal.
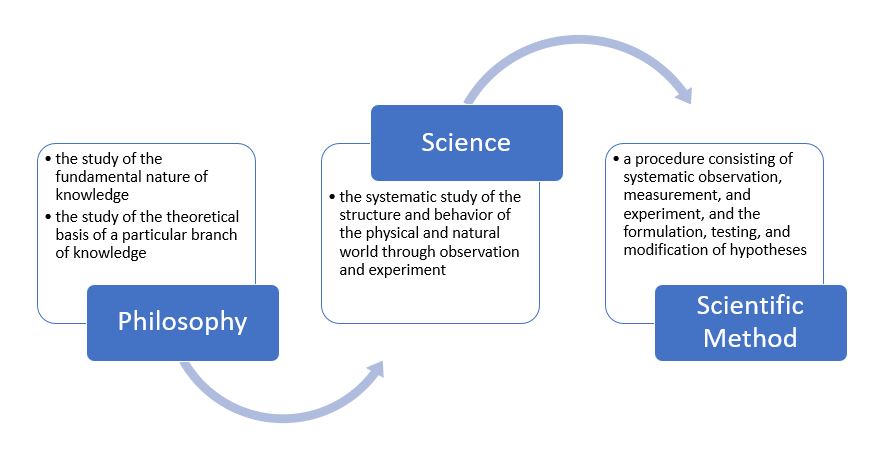
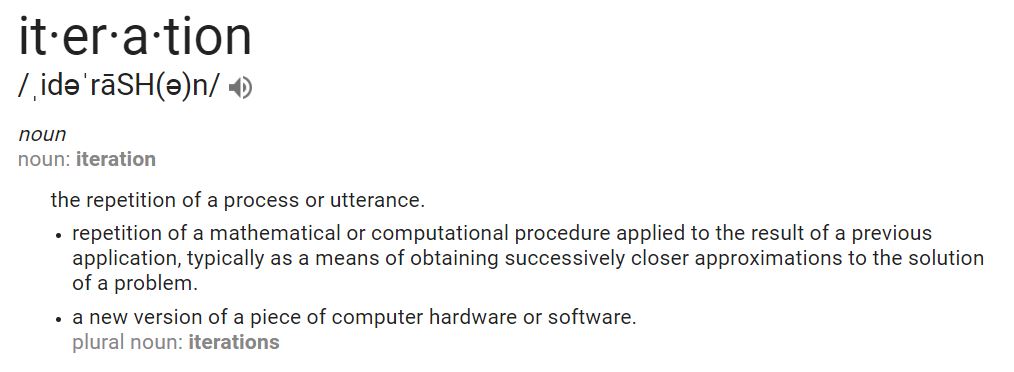
In most cases, the research proposal is based in the steps of the scientific method, which is entrenched in the philosophy of science. They are intrinsically linked. Many texts detail the scientific method as a 4-6 step linear process. However, in practice, the method is more iterative. The figure to the right is a better interpretation, it consists of 6 primary steps with backtracking and repetition as needed.

Please review the steps of the scientific method below. |
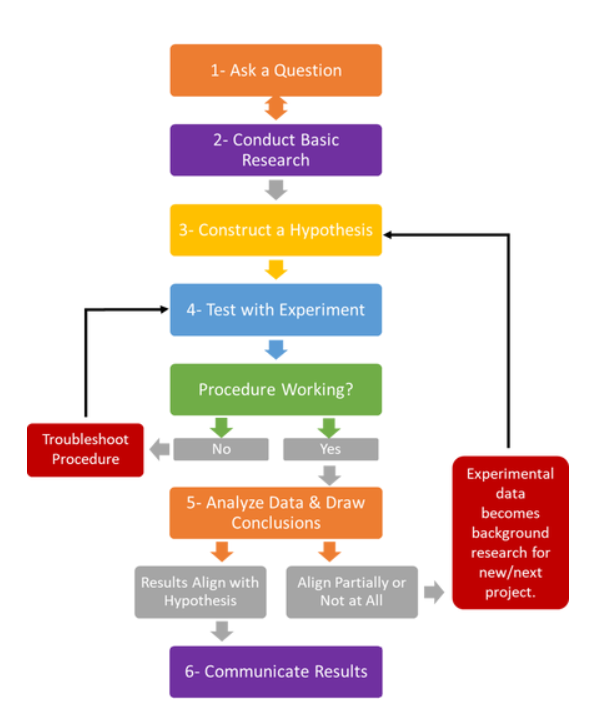
The scientific method. Click to enlarge.
|
- Ask a Question: Questions can arise from observations in the field, in the lab, from the scientific literature (e.g., scientific posters, presentations or papers), or from pre-existing data. In lab 1, you will develop questions from pre-existing data on the prevalence of diabetes across the U.S.
- Conduct Background Research: This is a literature review process, in which researchers dig deep into what is already known about their topic of choice and what questions still remain. Often, the literature review helps to refine questions and direct hypothesis formation. Background research will be provided to you for Lab 1, but you will be conducting thorough literature reviews in Unit 2.
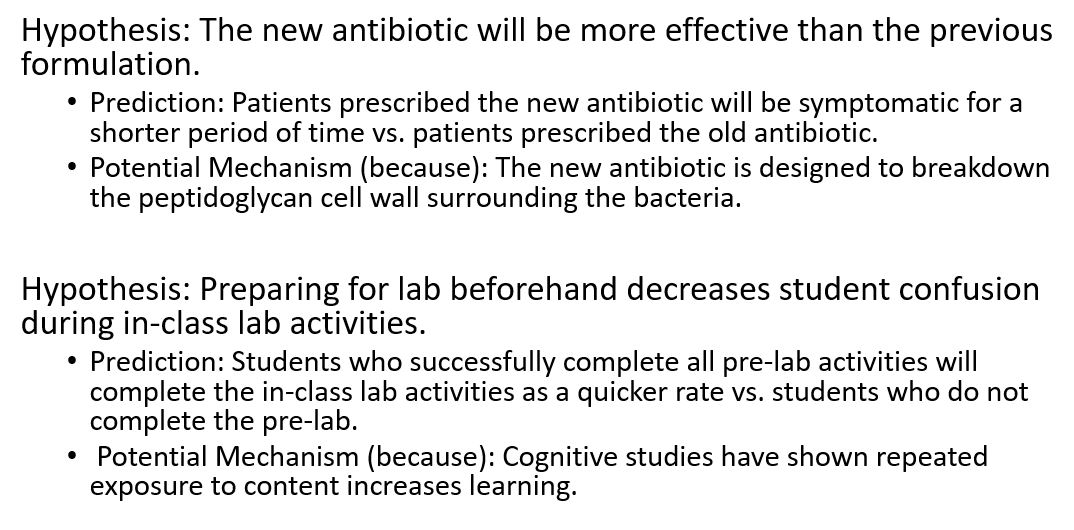
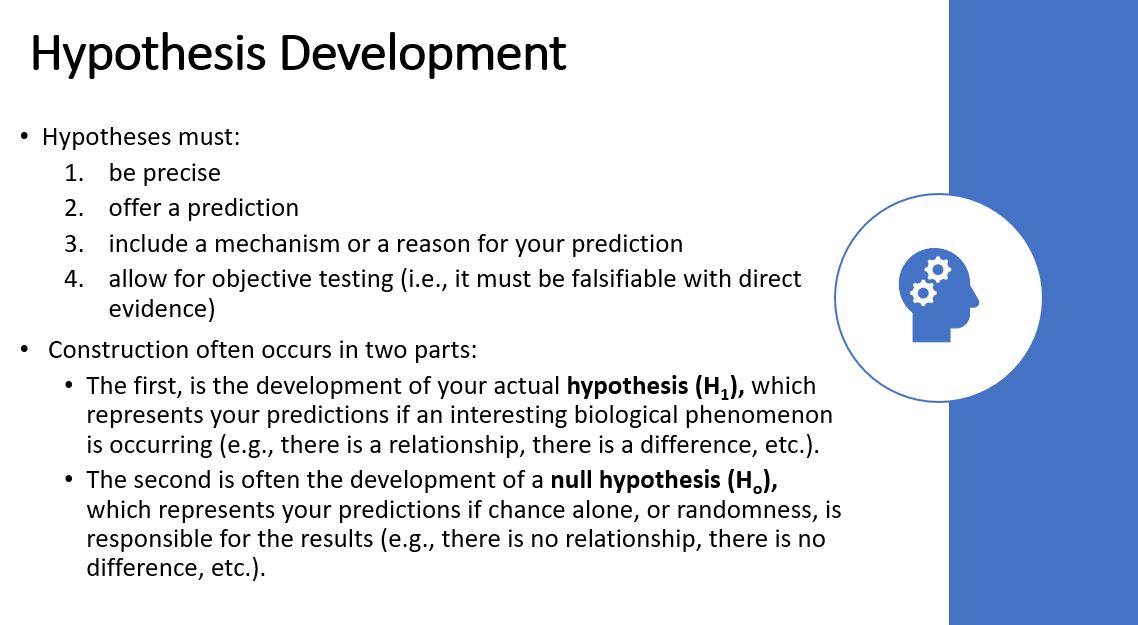
- Construct a Hypothesis. A quality hypothesis must be objective, measurable and testable. It must include a prediction and potential rationale (examples) based in the literature or from previous work. You will construct two independent hypotheses in Lab 1.
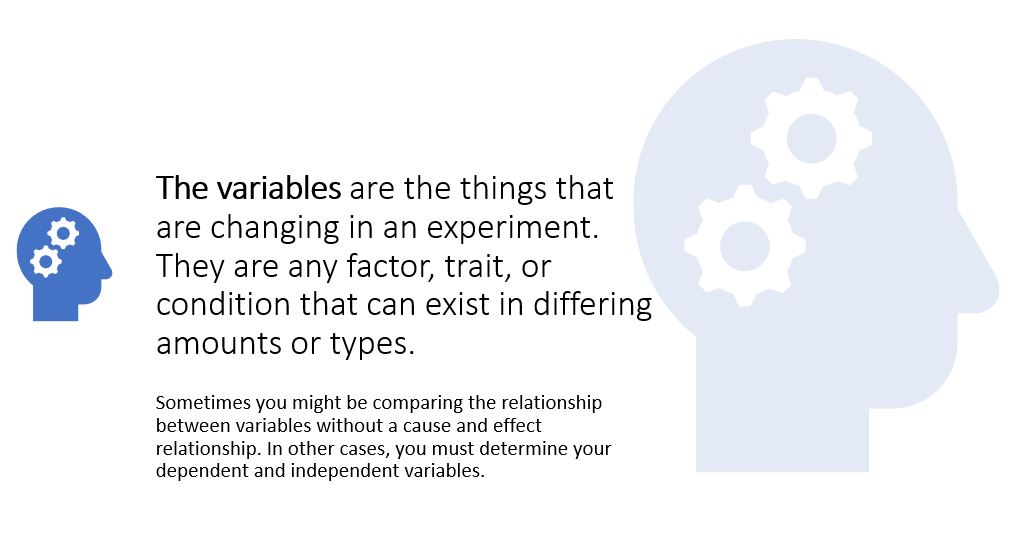
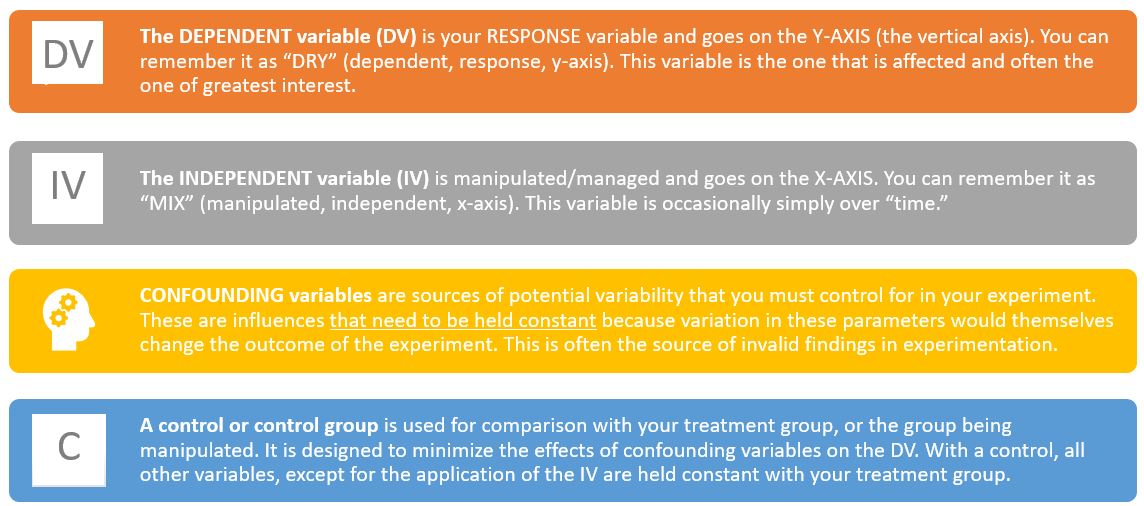
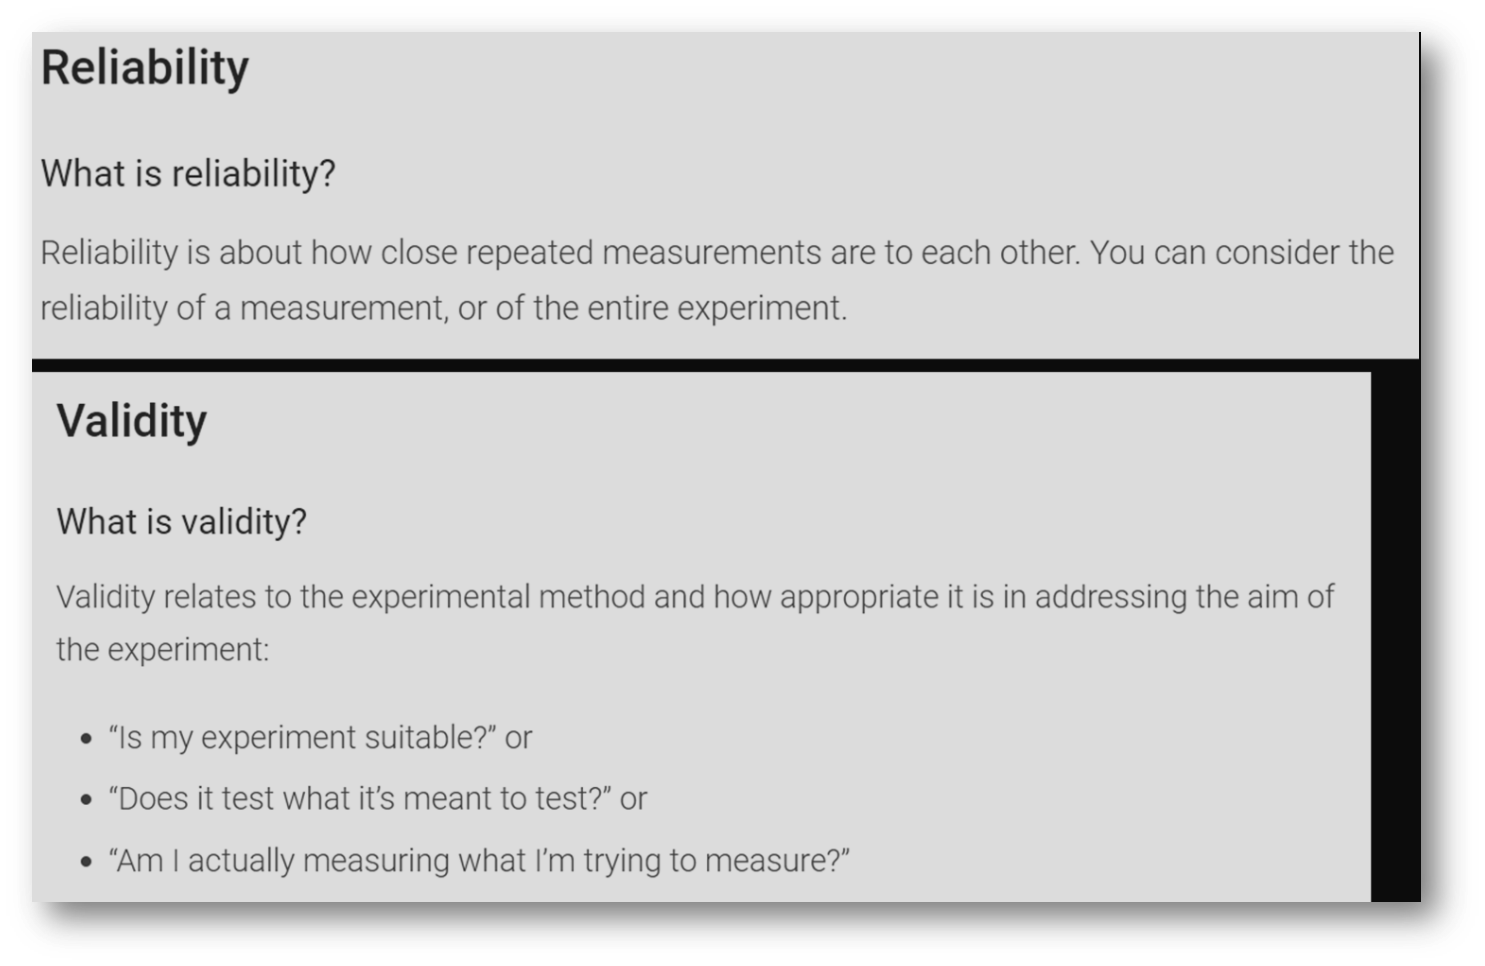
- Test the Prediction. There are various approaches to research design, based on your research question. These range from purely descriptive, to experimental designs, which involve manipulation of a variable or variables. Regardless of the method selected, the design should have clearly identified variables by type, and should be both valid and reliable.
- Analyze Data and Draw Conclusions. The methods used for analysis are largely based on the research design. In the biological sciences, analysis almost always involves the use of statistical tests and graphical representations of data. You will use a t-test and Pearson's correlation statistic to test your hypotheses in Lab 1. We will learn more about these tests in lab.
- Communicate Results. This last step is essential. For our understanding of the natural world to grow, new research must be shared, so others can draw on what's known, to learn more. Results can be communicated through technical reports, presentations at conferences, scientific posters, and manuscripts which appear in scientific journals. The proposal and analysis you begin in Lab 1 will form the basis for a technical report you will present to the class in Lab 5.
We will complete this process many times during this course. Lab 1 is designed to expose you to both the scientific method and to the construction of a research proposal.
Do you know enough about diabetes?
Diabetes is a disease that occurs when your blood glucose, also called blood sugar, is too high. Blood glucose is your main source of energy and comes from the food you eat. Insulin, a hormone made by the pancreas, helps glucose from food get into your cells to be used for energy (we will explore this biochemical pathway in Lab 4). Diabetes results from disruption of this pathway, the body doesn’t make enough—or any—insulin or doesn’t use insulin well. Glucose then stays in the blood and doesn’t reach the cells. Over time, having too much blood glucose can cause many serious and chronic health problems.
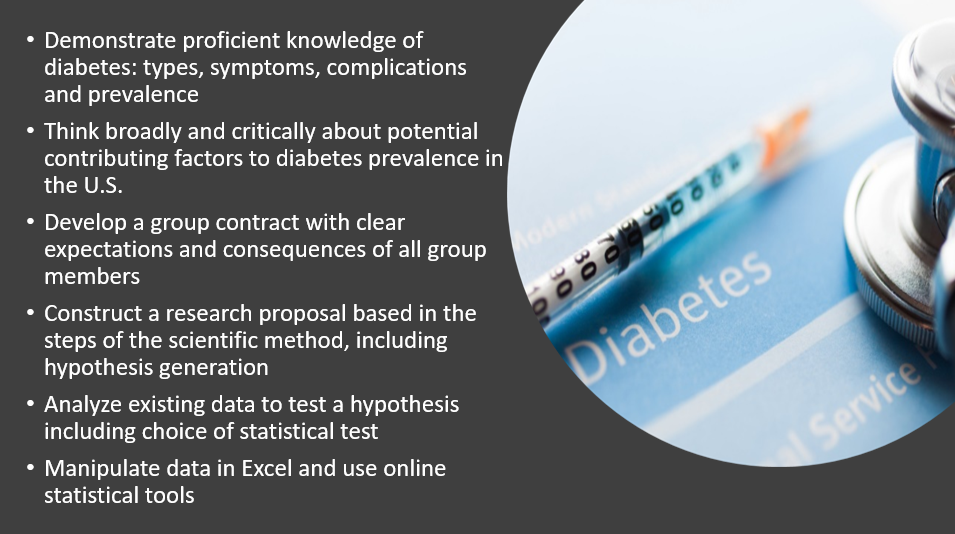
For the purposes of Lab 1 you need to know some general information about diabetes: the different types (we will focus on type 2) & causes of each, symptoms, complications and disease prevalence.
For the purposes of Lab 1 you need to know some general information about diabetes: the different types (we will focus on type 2) & causes of each, symptoms, complications and disease prevalence.

Please review the slideshow.
Do you know enough about how to use Excel?
We will use Excel quite often in BIOL 121. Are you comfortable with it?
- Here is a quick 5 minute explainer: https://www.youtube.com/watch?v=3GJTjMeJeFk
- Here is a more in-depth tutorial: https://www.youtube.com/watch?v=rwbho0CgEAE

Please be sure you have Excel downloaded to your device. The web version is not sufficient. You can download Excel (and all of Microsoft Office) here.

Please review whichever Excel video best fits your current comfort level with the program.
What will we do in lab and how will we do it?
|
You will complete three exercises in Lab 1.
1) Create a Group Contract: You will begin working together on a group project in Lab 1, the first of many group activities this semester. You first job as a team will be to decide how you will work together and what the consequences of not fulfilling your individual role may be. You will create a group contract and identify your roles within the group. 2) Create a Research Proposal: You will be asked to explore the diabetes data set and to design a research proposal with two types of questions. One question that asks about the DIFFERENCE between the incidence rate for diabetes in any two groups you select, and another question that asks about the RELATIONSHIP between the incidence rate for diabetes and another variable of your choosing

Please look over the diabetes data set in the sidebar and start to think about what types of questions you could ask.

Review the figure in the sidebar on research questions and statistical tests. It will help you to order your thoughts regarding each type of research question you will construct.
We will focus on determining the RELATIONSHIP between two variables during Unit 1 and the DIFFERENCE between two variables in Unit 2. |
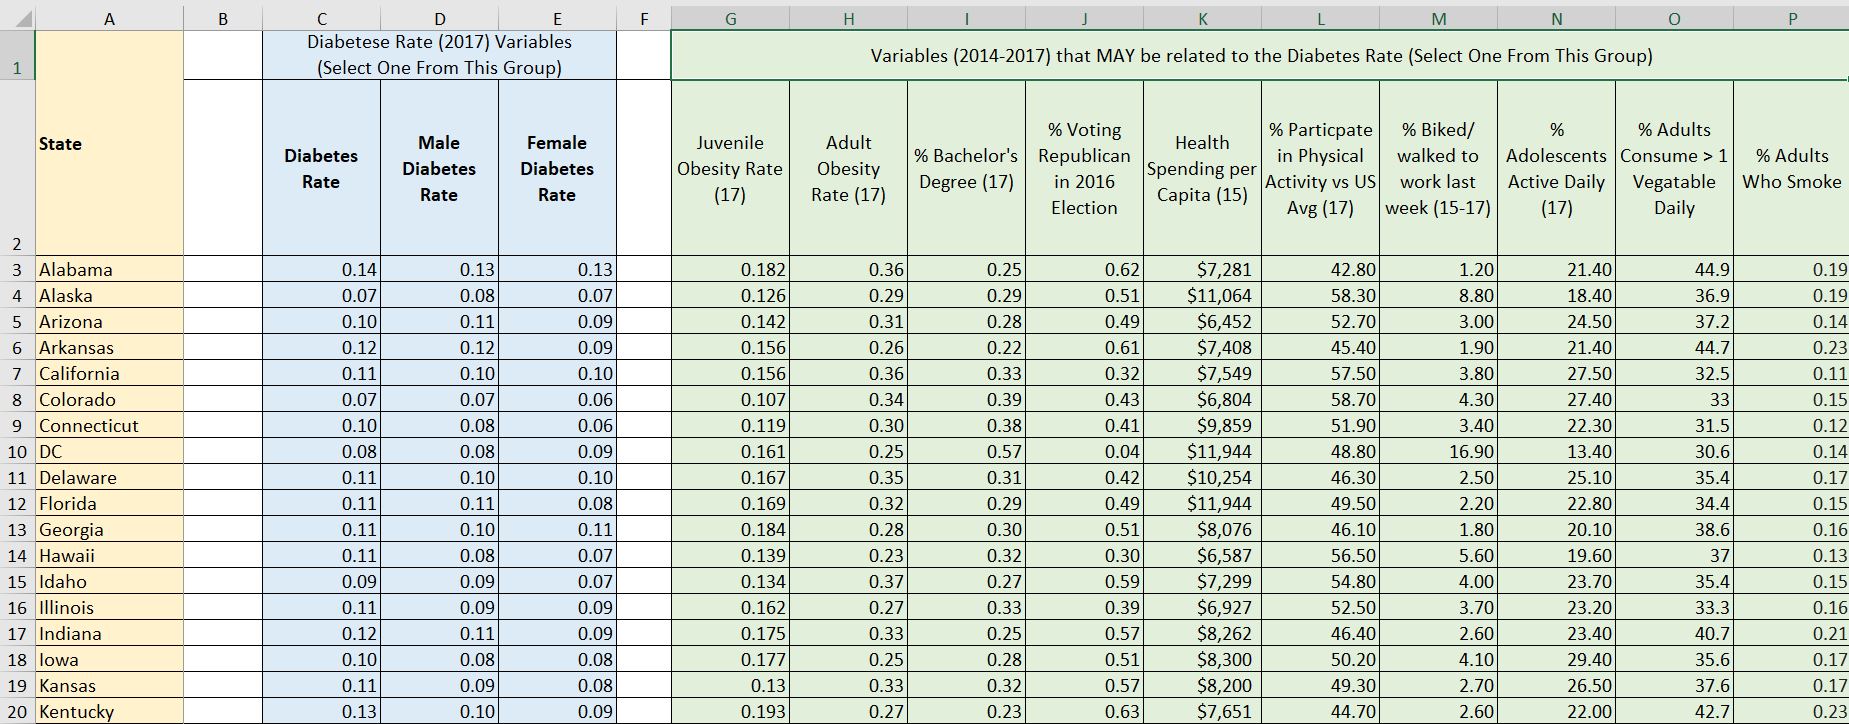
Diabetes dataset in Excel.
Click image to download.
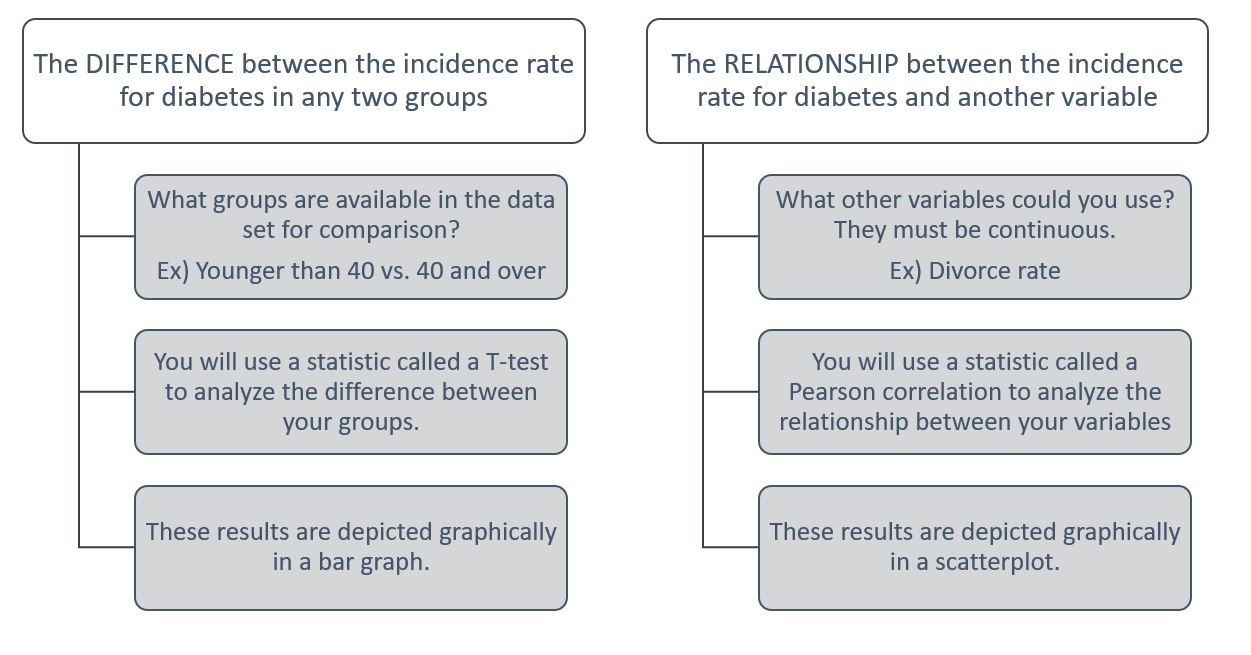
Research question examples and types of statistical tests. Click to enlarge.
|
3) Begin Preliminary Analysis: After you construct your research proposal, and it is approved, you will begin to test your hypothesis using an online statistical calculator for a correlation test. This analysis will carry over to labs 2-5 and will form the basis of a technical report you will write regarding your Unit 1 research.

If you feel confident with this material, click the bridge icon below and navigate to Blackboard to take the LABridge for week 1.
Be ready to tested on this material before you go to the quiz. It is a timed assessment. * Please note, there is no Lab Notebook assignment for LABridge 1.
Be ready to tested on this material before you go to the quiz. It is a timed assessment. * Please note, there is no Lab Notebook assignment for LABridge 1.

Click here to get to WKU's blackboard to take your LABridge for this week. Be sure your Notebook Entry from last lab is ready to submit!
Lab 1: ProtocolIn today's lab you will work with your new group to develop a team contract that will serve you throughout this course. You will also begin your first research project by creating a research proposal and running some initial analyses.
Exercise I. Develop a Group Contract Exercise II. Create a Research Proposal Exercise III. Begin Analysis |
Lab Objectives: Following today's lab, you should be able to...
|
Create Your Group Contract
Procedure
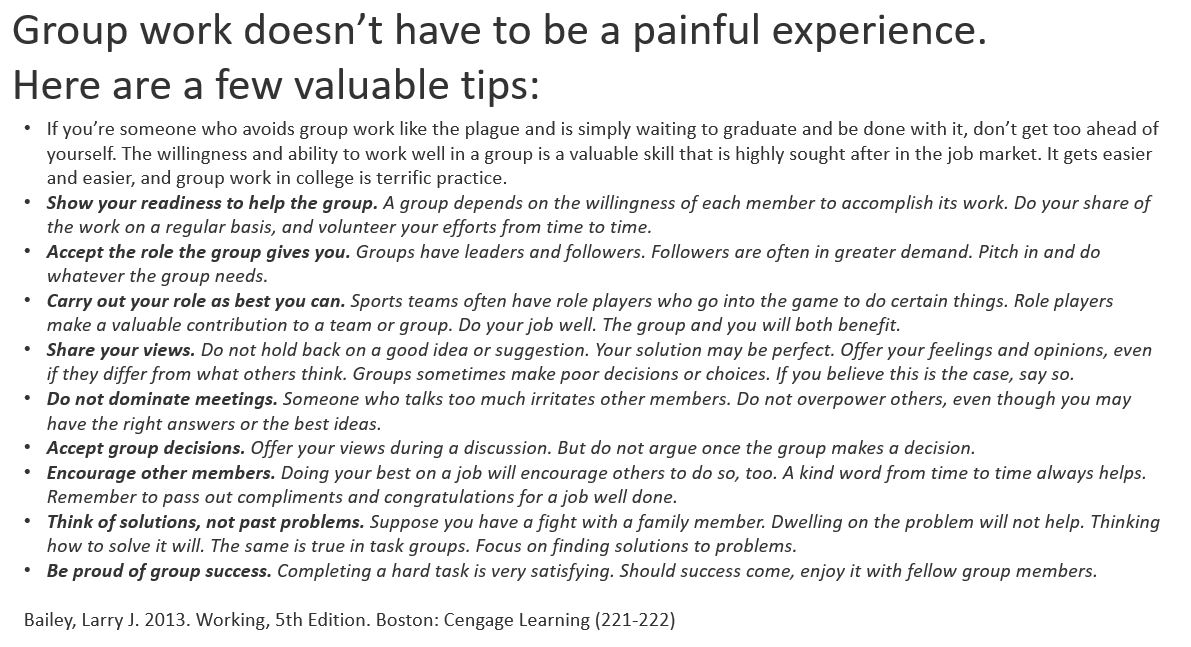
- Depending on your past experiences and your own personality, group work may be exciting or dreaded. Please review THESE TIPS, individually, then discuss them with your group.
- Review the description of group roles below.
- Download and complete the group contract form.
- Ensure all members have an electronic copy for reference and be ready to show it to your instructor if asked to do so.
- Lastly, review the peer evaluation form you will complete at the end of this course.
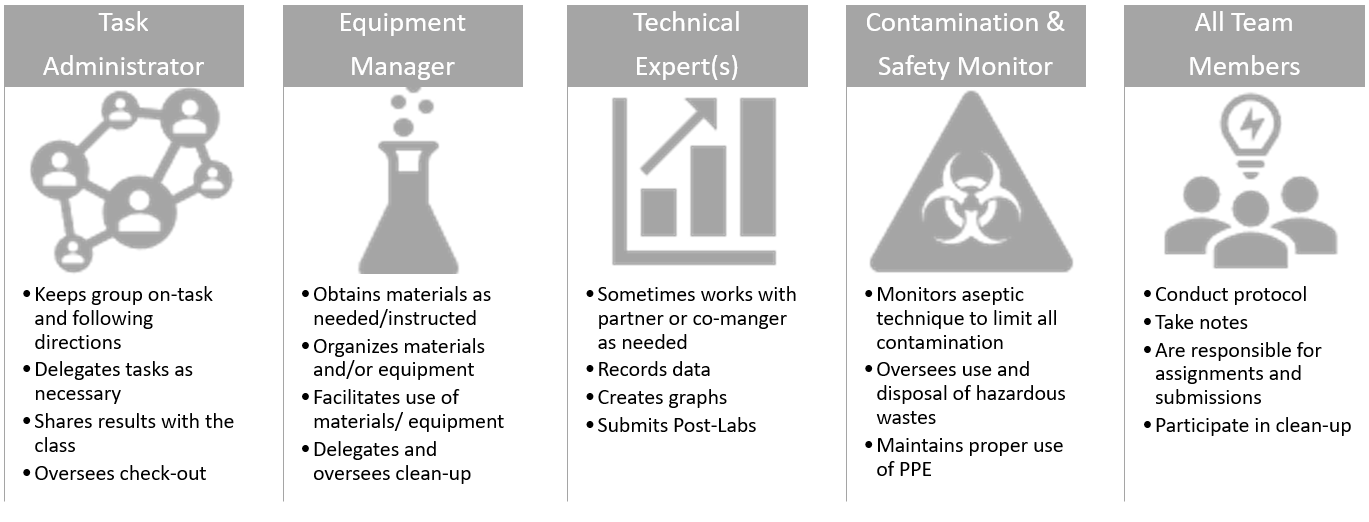
Activity Roles for Group Work. Click to enlarge.
|
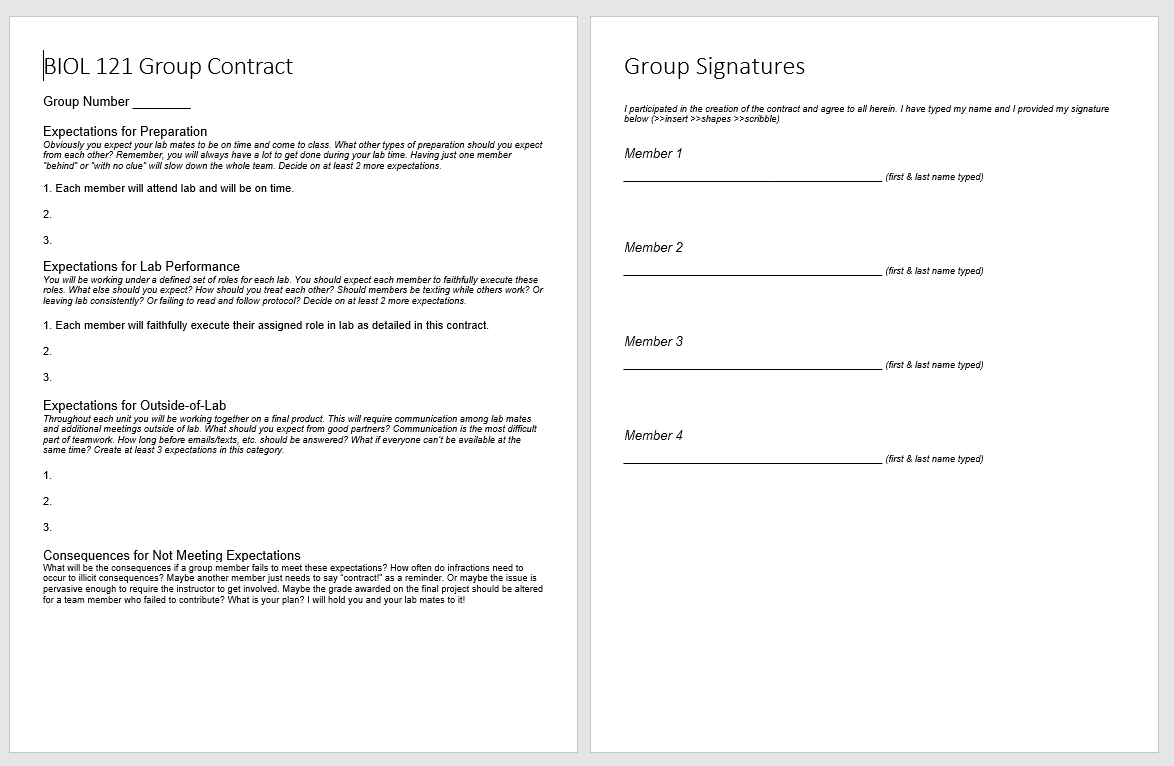
Group Contract Template. Click to download.
|
Construct Your Research Proposal
Your first research project: The ultimate goal is for you to create a technical report that, in some way, expands our understanding of the diabetes epidemic in the U.S., using our diabetes data set. You must first get your project idea approved, and therefore need to construct a research proposal.
In the pre-lab, you learned what a research proposal is and how it is linked to the steps of the scientific method. This initial proposal is very basic and we will build on it in subsequent labs. Remember, you are creating a research questions about the RELATIONSHIP between the rate of diabetes and one other variable.
Remember: A quality hypothesis must be objective, measurable and testable. It must also include a prediction and potential rationale (examples). Think about how your questions may connect with what we already know about the diabetes epidemic and related factors.
Procedure
|

Diabetes dataset in Excel.
Click image to download.
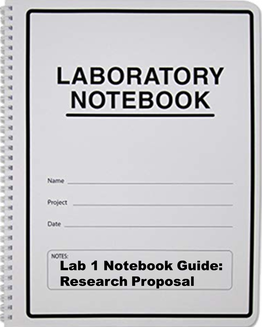
Lab 1 Notebook Guide: Research Proposal Template. Click to download.

Click to enter research library.
|
Begin Analysis
You will be working on analysis throughout Unit 1. At this point you know the names of each statistic you will use to test your hypotheses. But, depending on your background, you may not know much else about statistics. Why do we need them?
Different is different...why do we need to run a t-test? A relationship is obvious...why do we need to run a correlation?
We look for patterns to help us understand the natural world. As we do so, we are fighting our own human tendency to see patterns where none truly exist, and to take what we see in a specific context and try to apply it more broadly. Let’s say you notice that within your friend circle, those who regularly eat breakfast did much better on their first BIOL 120 exam than those who skipped your morning meals together. You might then assume that somehow, eating breakfast is causing the better grades. But! Consider the following...
- How much of a difference in test averages should there be between breakfast-eaters and breakfast-skippers for that to be true? 90 vs. 60? 80 vs. 70? Reasonable people could disagree.
- How often do you need to see this relationship for that to be true? On exam 1 and 2? On all the BIOL 120 exams? Reasonable people could disagree.
- Is it really the breakfast? Maybe students who are disciplined enough in their sleeping and eating habits are also more disciplined in their study habits? maybe chatting with other BIOL 120 students each morning is helpful? Reasonable people could disagree.
Statistics solve these problems. Using the principles of probability, they help us identify observations as random (chance alone) vs. meaningful (a real difference, or a real relationship). Statistics tell us how likely we would be to make the same observations we have made, if chance and randomness were the only drivers. If the probability is very low (<5%), we refer to these patterns as significant, very unlikely to be from chance alone.
Before you begin, make sure you have downloaded the diabetes data Excel sheet and saved it in your own files. The first tab should remain as the diabetes data set. You will use the subsequent tabs for your correlation results and analysis. Keep your data and results organized Procedure
|
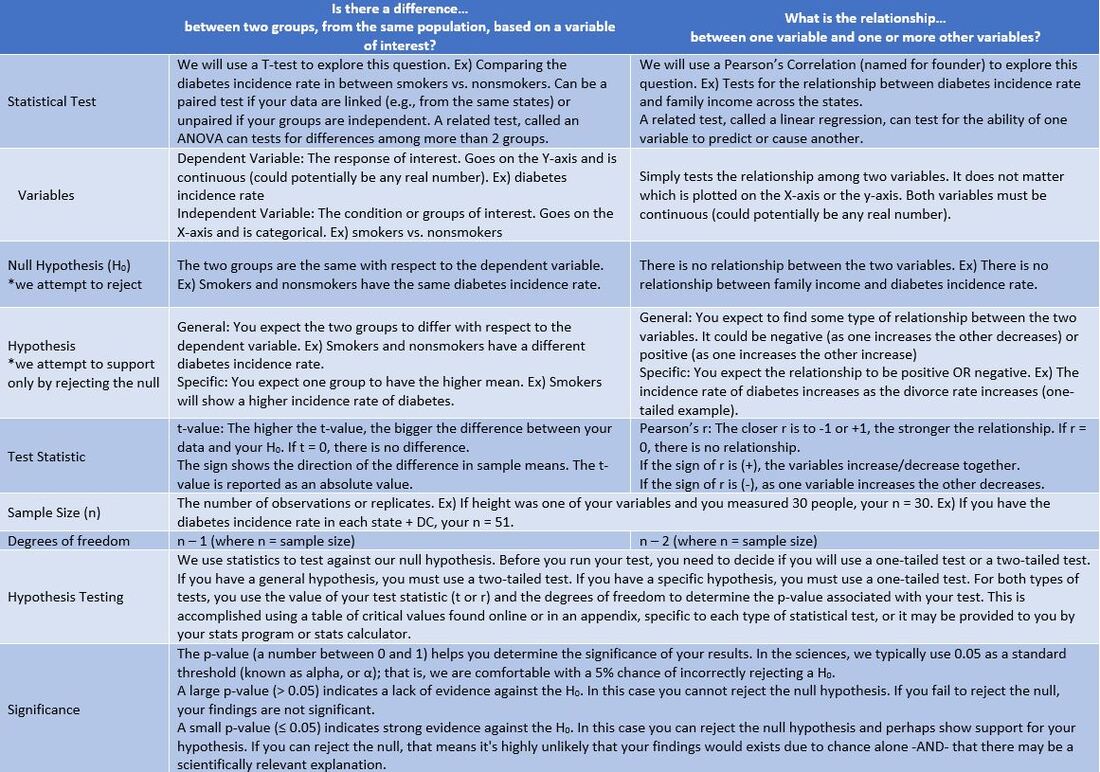
Comparing important concepts for each type of test. Click to enlarge. Review the statistics we will use and associated concepts in this table. Discuss the contents with your group and ensure everyone feels confident with material before moving on to the procedure. Remember, we are focused on the possible relationships between these variables.
|
|
Lab 1 BIOL 120 CONNECTIONS Section 1.6: Doing Biology Big Picture 1: How to Think Like a Scientist BioSkillls 2: Reading & Making Graphs BioSkillls 3: Interpreting Standard Error and Using Statistical Tests BioSkillls 4: Working with Probabilities |
Faculty Spotlight: Dr. Doug McElroy

Email: [email protected]
|
Dr. McElroy is a solver of puzzles. He enjoys trying to make the pieces fit and finding new ways to understand old problems. Often, he applies the processes of scientific inquiry to new issues that have not benefitted rom the approach in the past. PLUS, he is a statistical expert. Much of his perspective has been translated into Unit 1. Dr. McElroy's current research focuses on applying evolutionary principles and multivariate statistical methods to examine processes of curricular change and assessment in higher education. Past research interests have addressed questions related to wildlife molecular forensics, morphometrics and conservation of desert fishes, genetics and speciation in African cichlid fishes, and the statistical analysis of population genetic data. Reach out to him if you have interests in statistics or evolutionary biology. |
|
The Department of Biology at WKU strives to create a dynamic, experiential learning environment, and to be a destination department for competitive undergraduate and graduate students, involving them in the process of science and preparing them for success in a global society. This website is intended solely for use of BIOL 121 students. The information here is copyrighted or within "Fair Use" under the scholarship or education exemption.
|
|
KAS citation format:
Mountjoy, N.J 2021. Title of page. Biological Concepts: Cells, Metabolism & Genetics. https://www.121cellmetagen.com. Date accessed (MM/DD/YYY).
Mountjoy, N.J 2021. Title of page. Biological Concepts: Cells, Metabolism & Genetics. https://www.121cellmetagen.com. Date accessed (MM/DD/YYY).