Lab 2: Pre-Lab
Your task in Lab 2 is to continue with your data analysis from the diabetes data. You will review feedback from your research proposal, continue your statistical analyses and begin working on your technical report.
Are you ready to move forward with your research?
For Lab 2 to go well, and for you and your group to get as much work done as possible, please ensure you have the most current version of the following documents:
|
Managing your documents and file storage is important and a helpful way to stay organized.
|

Ensure that you have a laptop or other device for use in lab. You MUST have access to Microsoft Office. The online version is not acceptable. Download here.
|

Be sure all these documents are current, saved, and easily accessible. Work on keeping things organized with proper file storage.
|

Review each one to refresh your memory! Make sure you are ready to discuss each one with your group. You might use the "review" tab in word to add comments or questions.
|

You might also want to bring head phones with you to watch the demos in class as needed. They are now all available in You Tube.
|
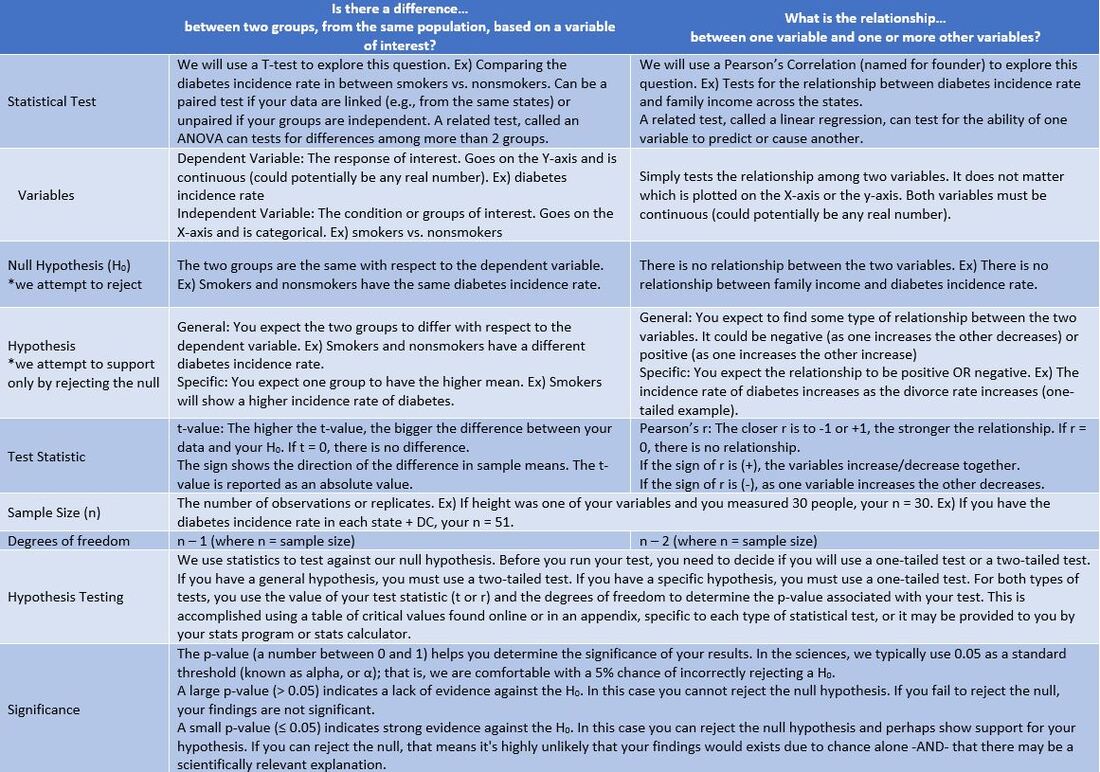
Do you understand enough about t-tests and correlations?

Review the content in the comparison table below. If you have ANY questions, use the links in the sidebar to explore these statistics and concepts further. Remember! In Unit 1, we are focusing on the "What is the relationship" side of this table! BUT! You will need to answer questions about BOTH types of tests in the LABridge.
What will we do in lab and how will we do it?
|
Lab 2 will proceed in 3 parts:
1) You will review research proposal feedback with your group. Do you need to make any changes? Did you select the right variables and use the right tests? Do you need to make revisions? You will confer with each other and your instructor as needed. 2) You will complete your statistical analyses and your graphing requirements for each hypothesis. All the relevant links, calculators and demos will be provided.
3) You will begin working on your technical report. You will be provided a scoring rubric and a template.
Please Note! During fall semesters this lab will be completed online only. Labs do not meet due to Labor Day. Everything you need for analysis is provided. In the spring, Lab 2 will be completed in the lab.
|
From Statistic. Click to visit page.
|

If you feel confident with this material, click the bridge icon in the sidebar and navigate to Blackboard to take the LABridge for Lab 2. Be ready to submit your Notebook Entry from last week (Word.doc ONLY) and to be tested on this Pre-Lab material.

Click here to get to WKU's blackboard to take your LABridge for this week. Be sure your Notebook Entry from last lab is ready to submit!
Lab 2: ProtocolIn today's lab you will work with your group on data analysis and then move on to start your technical report.
Exercise I. Review Research Proposal Feedback Exercise II. Continue with Data Analysis Exercise III. Begin Working on Your Technical Report |
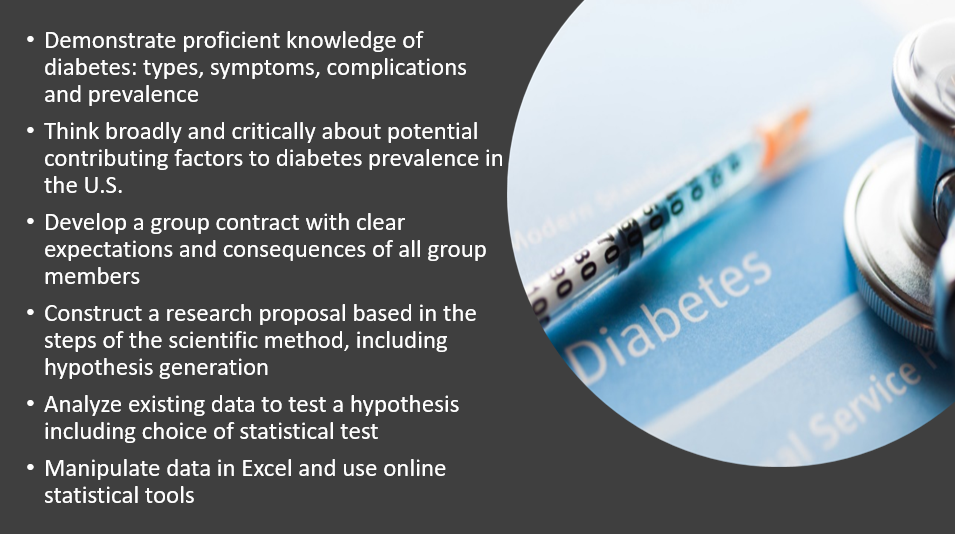
Lab Objectives: Following today's lab, you should be able to...
|
Exercise I. Review & Start Analysis: Run your correlation analysis
The primary goal here is to stop for a minute and take stock. Make sure you are all on the same page. Does everyone have the right documents? Does everyone feel confident in your research direction. Does everyone feel confident in the concepts and methods you have used so far?
|
Procedure
FAQ: What results do we report from the correlation test?
|
The YouTube video above demonstrates exactly how to set up your data to run a correlation.
Pearson's Correlation Online Calculator.
Lab 2 Notebook Guide. Click to download.
|
Exercise II. Create a scatterplot in Excel using your data
|
Procedure
|
General scatterplot tutorial in Excel.
Just watch to 2:08m. Scatterplot demo specific to your type of data and question.
|
Exercise III. Start to Prepare Your Technical Report
Each team member MUST submit the report individually in blackboard before the due date/time. Reports will not be accepted late, even if others from your group already turned them in. We will learn more about diabetes in the next few weeks but please remember to work on your report as an on-going project. Important dates are listed below along information on the assignment.
|
Procedure: Complete your Technical Report
Formatting Guidelines:
Review the "cations" section in our library if you have questions. Ask your TA if you 'll be using APA or KAS format for this project.
|
Click on the image above for an example of a Technical Report, Your report will not include any table of contents, will be shorter, and will include less depth. But this example is a great frame of reference.
|
|
Lab 1 BIOL 120 CONNECTIONS Section 1.6: Doing Biology Big Picture 1: How to Think Like a Scientist BioSkillls 2: Reading & Making Graphs BioSkillls 3: Interpreting Standard Error and Using Statistical Tests BioSkillls 4: Working with Probabilities |
Faculty Spotlight: Dr. Doug McElroy
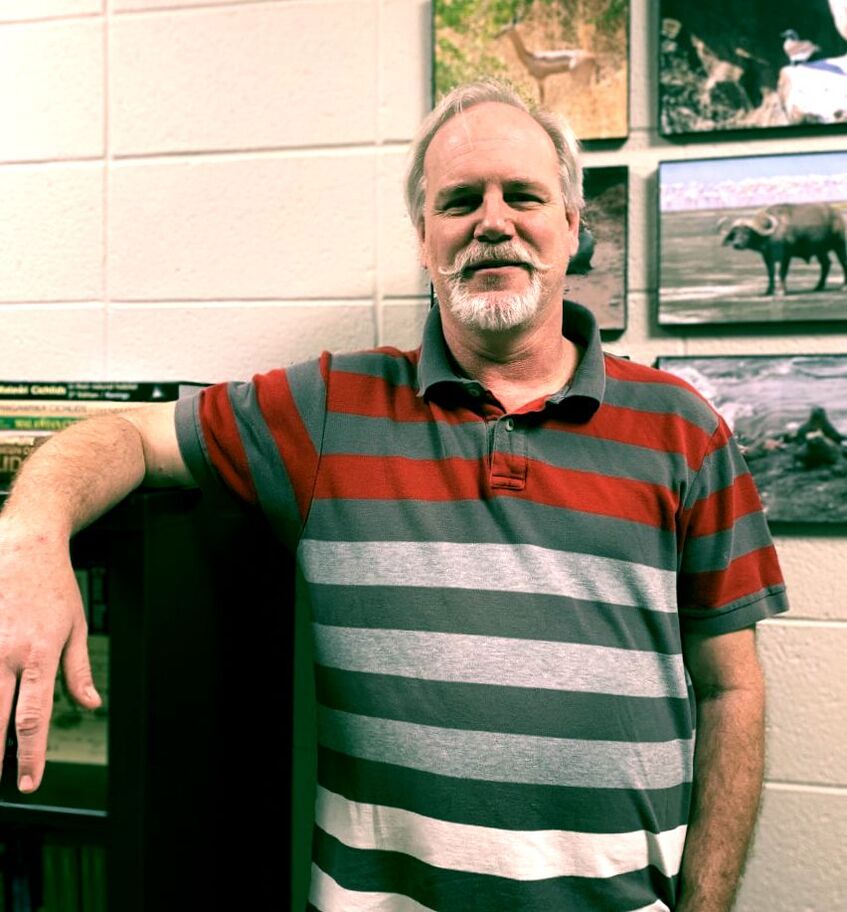
Email: [email protected]
|
Dr. McElroy is a solver of puzzles. He enjoys trying to make the pieces fit and finding new ways to understand old problems. Often, he applies the processes of scientific inquiry to new issues that have not befitted from the approach in the past. PLUS, he is a statistical expert. Much of his perspective has been translated into Unit 1. Dr. McElroy's current research focuses on applying evolutionary principles and multivariate statistical methods to examine processes of curricular change and assessment in higher education. Past research interests have addressed questions related to wildlife molecular forensics, morphometrics and conservation of desert fishes, genetics and speciation in African cichlid fishes, and the statistical analysis of population genetic data. Reach out to him if you have interests in statistics or evolutionary biology. |
|
The Department of Biology at WKU strives to create a dynamic, experiential learning environment, and to be a destination department for competitive undergraduate and graduate students, involving them in the process of science and preparing them for success in a global society. This website is intended solely for use of BIOL 121 students. The information here is copyrighted or within "Fair Use" under the scholarship or education exemption.
|
|
KAS citation format:
Mountjoy, N.J 2021. Title of page. Biological Concepts: Cells, Metabolism & Genetics. https://www.121cellmetagen.com. Date accessed (MM/DD/YYY).
Mountjoy, N.J 2021. Title of page. Biological Concepts: Cells, Metabolism & Genetics. https://www.121cellmetagen.com. Date accessed (MM/DD/YYY).