Lab 11: Pre-Lab
Over the next several years BIOL 121 students will be testing meat samples from Kenya, through DNA analysis, to determine if poaching and bushmeat use is threatening conservation efforts. We are currently testing the procedures that will be used for this research project. You will be provided the output of various steps so you can complete the process of species identification. In labs 10-12, your task will be to identify the species of origin of a meat samples from Kenyan butcheries. You will learn about poaching, the bushmeat crisis and practice key techniques to complete DNA analysis of your samples. To prepare for Lab 11, please review this pre-lab. Once you feel confident regarding the below topics, and have your Lab Notebook ready from last week, complete the corresponding LABridge in Blackboard.
Review the steps of DNA Analysis
In Lab 11 we will run a gel to make sure we amplified DNA and that we made copies of the correct gene. We will also try to determine how much DNA we have to complete our analysis following amplification via PCR.
Be certain you're comfortable with PCR! Most of your LABridge questions this week will be on step three! It is a tough topic so extra review is warranted!

Please review the steps and sequence below, with a focus on steps 3 & 4.
1) Sample PROCESSING
|
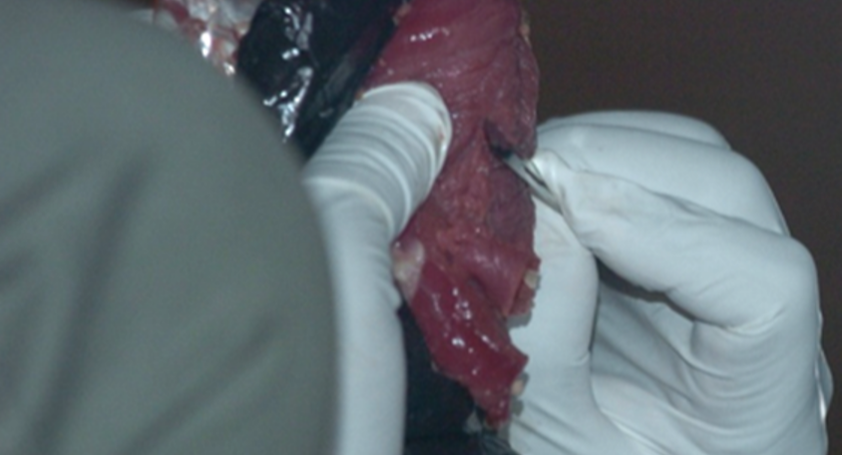
Bushmeat Processing: Using aseptic techniques, the bushmeat samples are cut into approximately 1 cc sections. They labeled and stored in ethanol at -20 degrees Celsius. Special care is taken to ensure no cross-contamination or human contamination occurs. Samples are then carried back or shipped to the WKU biotechnology Center. -----> This has already been done. |
2) Digestion & Extraction
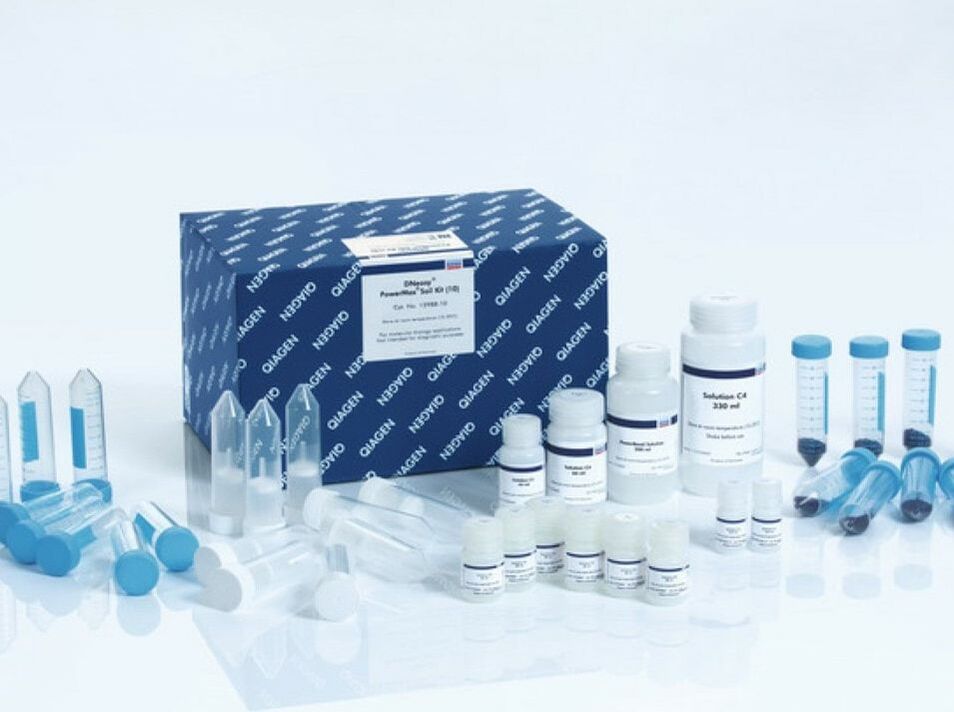
|
This process is similar to the extraction we completed with the strawberry. However it involves many more steps and results in a cleaner product with far less protein. We use special "kits" as pictured to streamline the process. Digestion liquefies the tissue in such a way that keeps the DNA intact for extraction. Once extraction is complete, the DNA sample is tested to ensure an adequate amount of intact DNA was extracted from the sample. -----> This process has already been done with our meat samples. In Lab 10, you will practice extracting DNA from a strawberry to better understand this process |
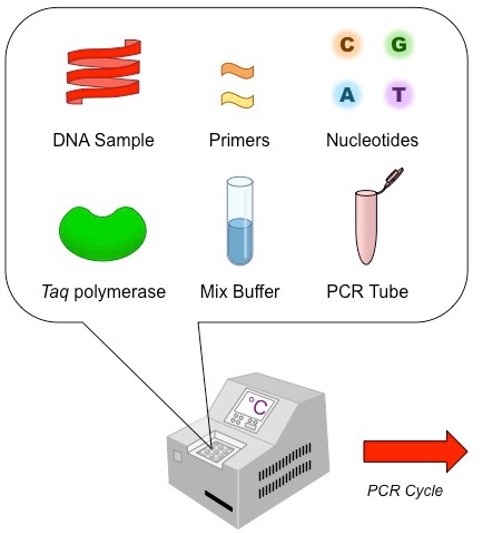
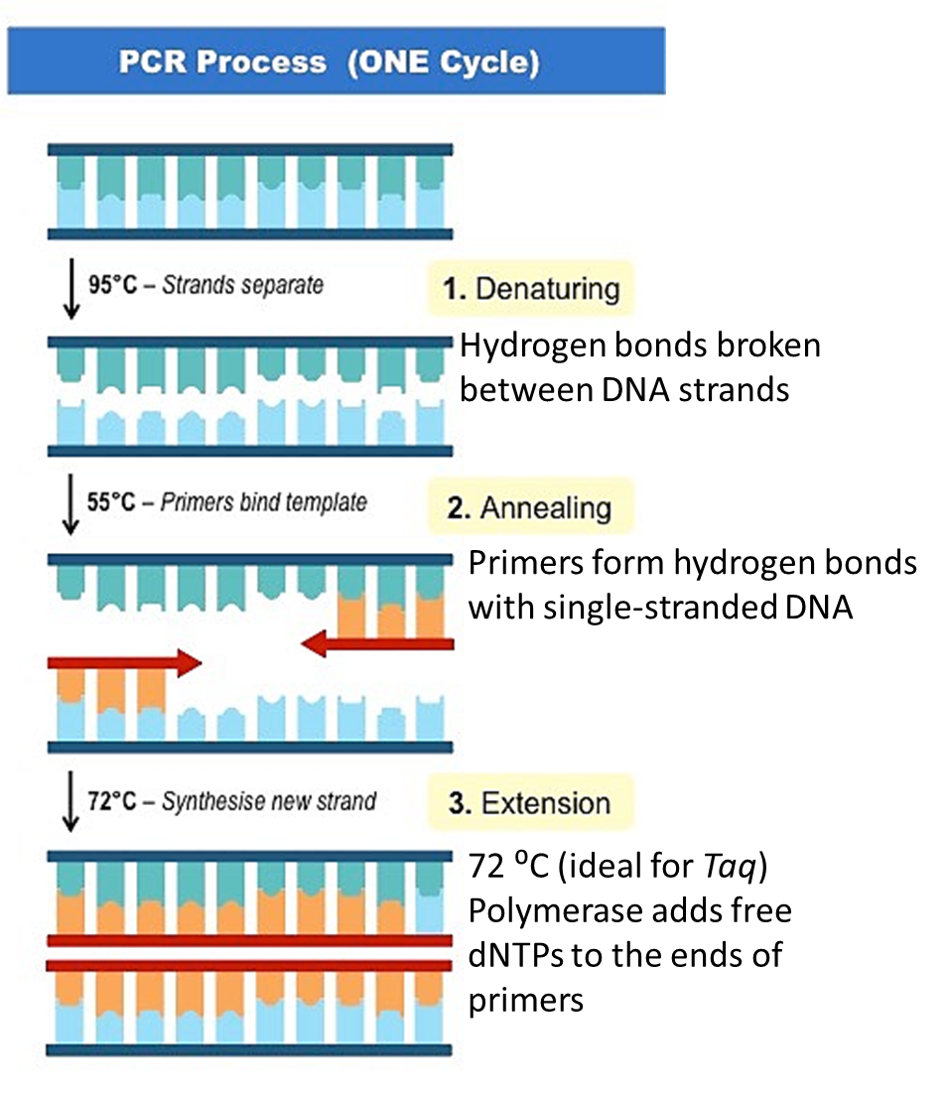
3) Polymerase chain reaction (PCR)
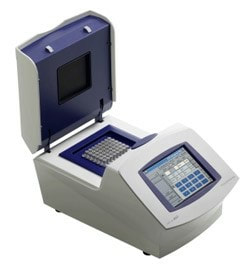
|
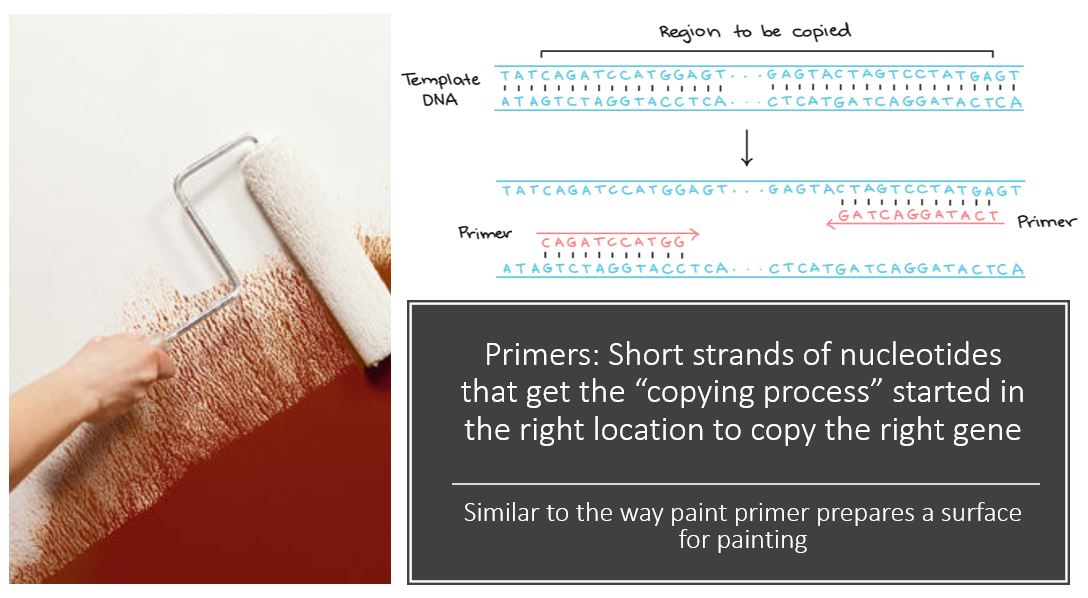
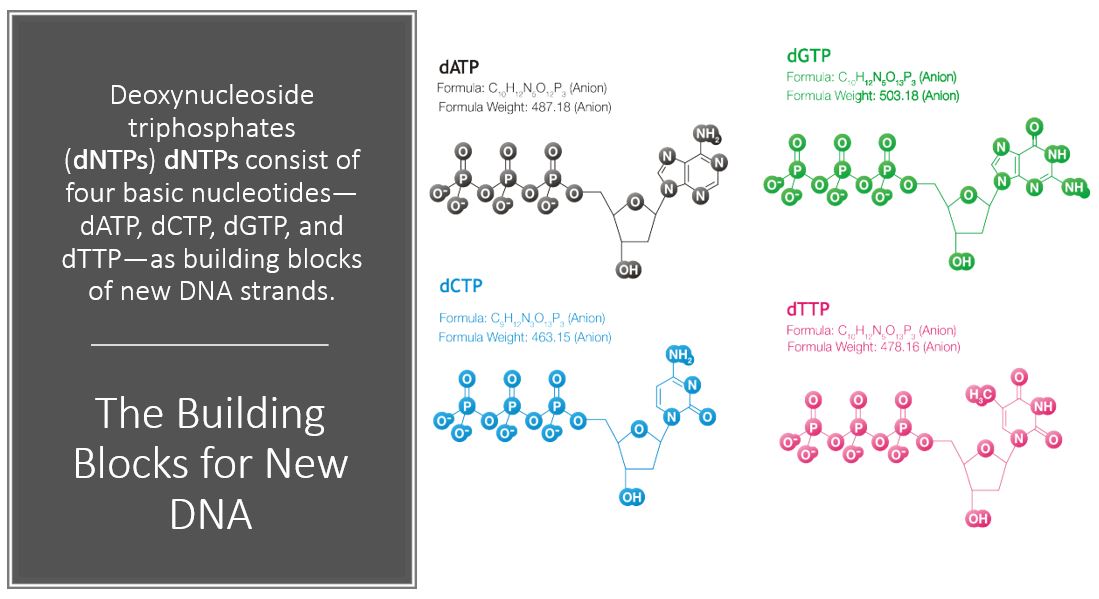
PCR makes copies of a DNA fragment from one original copy. The goal is to amplify a specific region, the target DNA or gene of interest (GoI), depending on the type or goal of research. The PCR cocktail includes the following ingredients: the DNA sample, primers (short sequences of RNA or DNA that start replication), dNTPs (free nucleotides), taq polymerase (a heat stable form of DNA polymerase derived from bacteria) and a buffer solution. There are three steps to PCR in which the temperature is cycled (in the thermo"cyler"). You need to know the steps and what happens in each! The total number of resulting DNA strands is (the number of original strands) X 2^n, where n = the number of PCR cycles. -----> In Lab 11, you will be given PCR products from our meat samples in lab and asked make some calculations. |
4) Gel electrophoresis
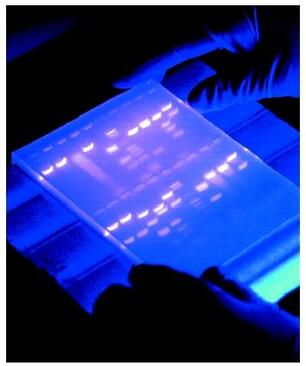
|
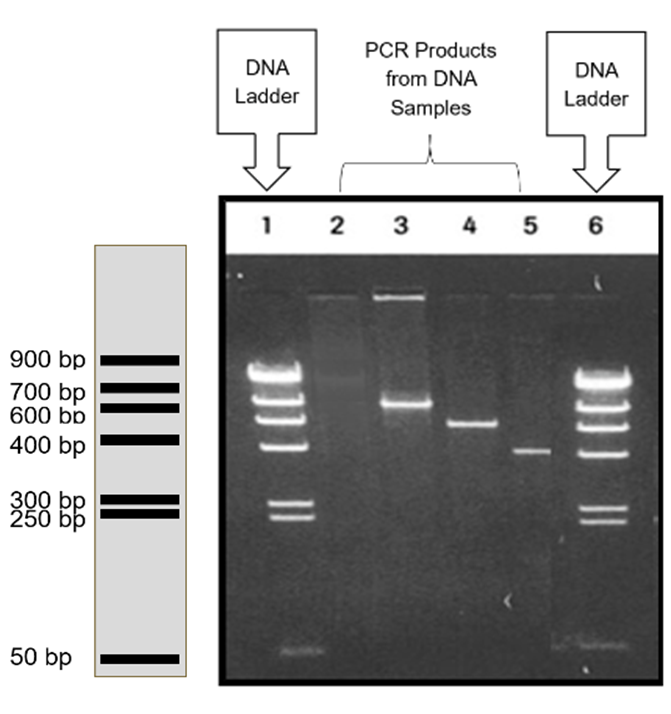
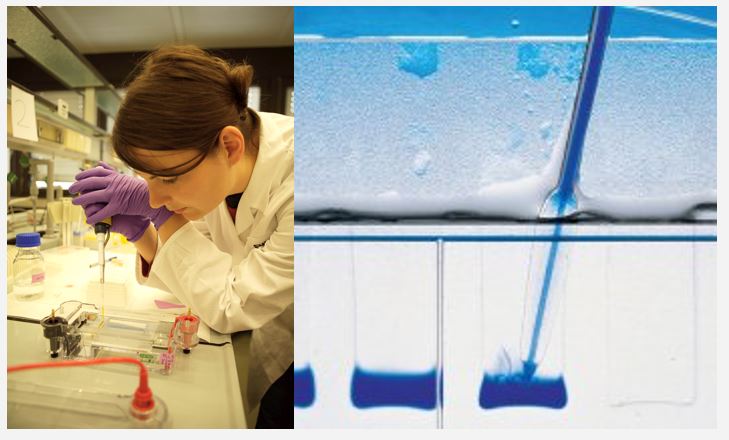
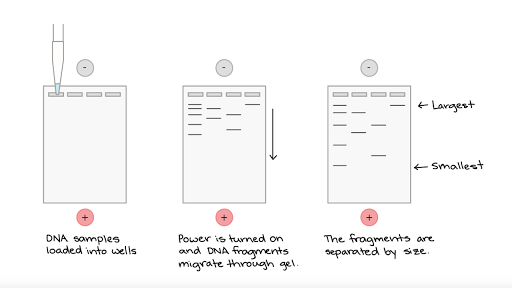
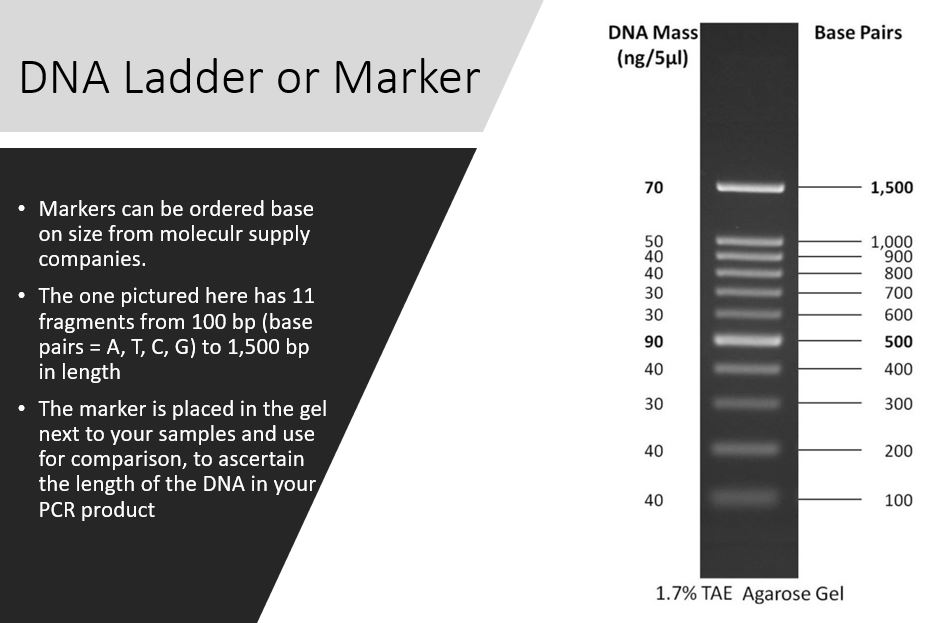
Agarose gel electrophoresis is a method used to separate DNA strands by size, and to determine the size of the separated strands by comparison to strands of known length. Your PCR products are deposited in the top of the gel. Using electricity, the DNA (with a negative charge) is pushed through the gel towards the positive electrode. As your gel "runs," the DNA is separated by size. The DNA strands show up as bands under UV light and you can read the results. Your products can be compared with the ladder or marker, which has standard sized DNA fragments of KNOWN length used for comparison. In this way, you can know the exact length of your DNA samples. -----> You will MAKE & RUN an agorose gel in Lab 11 to make sure our PCR product contains the cytochrome b gene. |
5) Sequencing
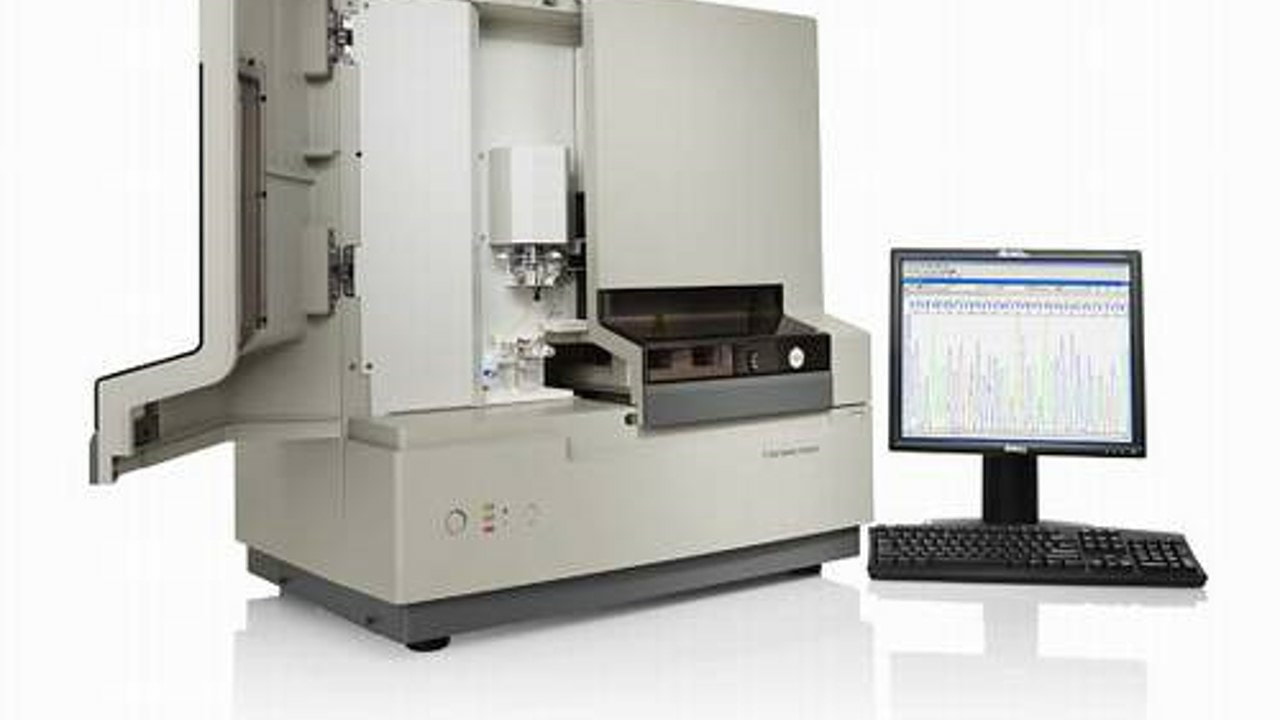
|
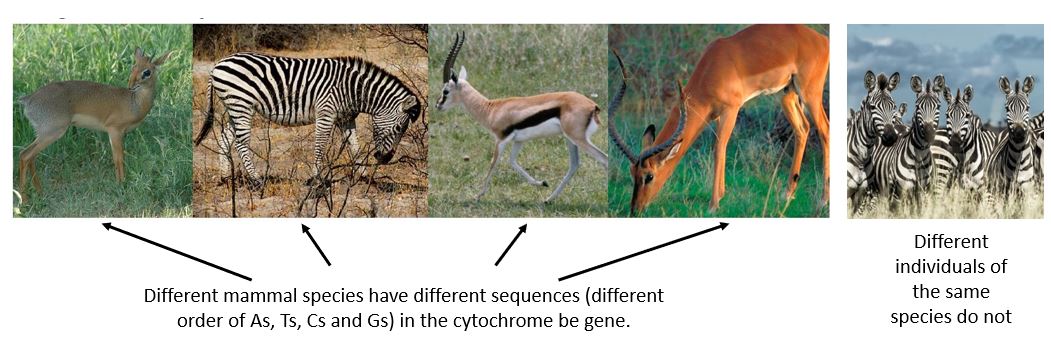
Once we know we have amplified (copied) the right gene we are ready to sequence the gene. We expect the sequence (the order of As, Ts, Cs and Gs) within the cytochrome b gene to be different for different species. Samples are placed into a sequencer apparatus which can detect the order of nucleotide bases in our sample. The sequence is then cleaned and edited, |
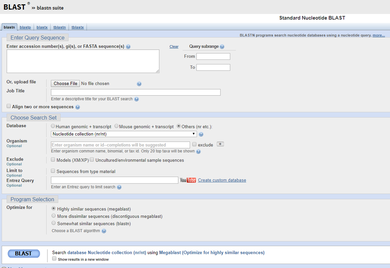
6) BLASTing
|
6) BLASTing: The National Institute of Health (NIH) and National Center for Biotechnology Information (NCBI) hosts a database called GenBank, which houses all known DNA sequences. Once the sequences of our samples are ready, they are pasted into a search tool (called a BLAST) which matches them to the correct species! -----> You will be provided the sequence of successful samples in Lab 11 and asked to determine the species of origin in lab. |

Review the comparison of PCR with DNA synthesis.
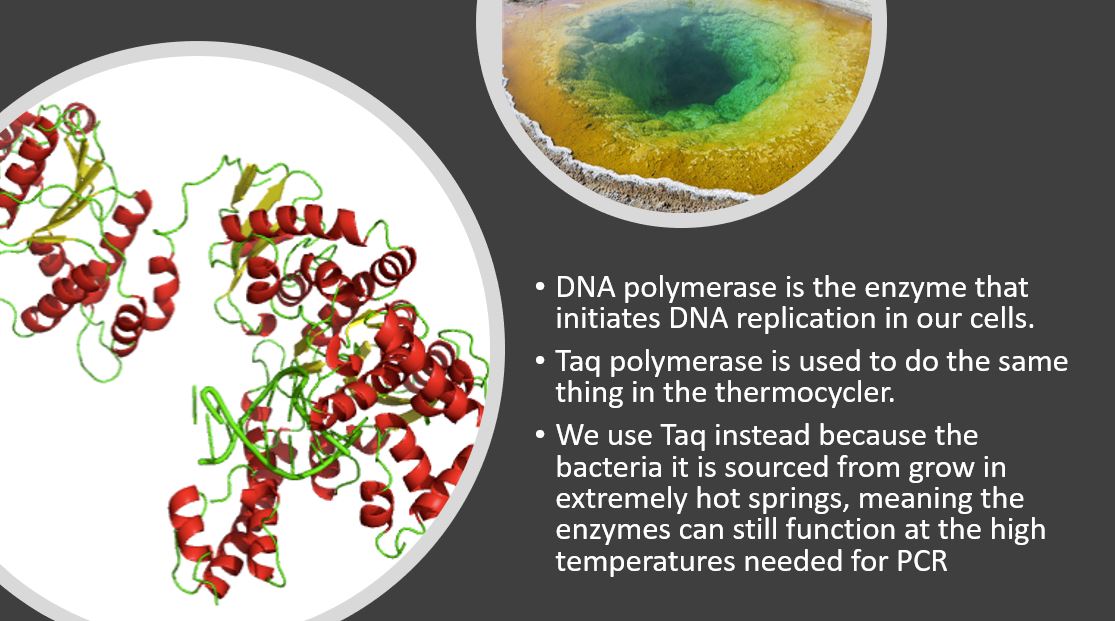
You'll review the entire process of DNA synthesis in BIOL 120. In it, DNA polymerase builds the new copies of DNA strands from the original template.
|
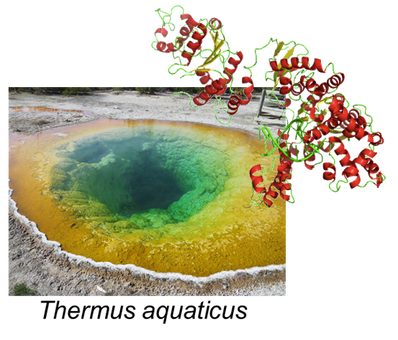
We use Taq-Polymerase in the same way in PCR. It is an enzyme from heat resistant bacteria (Thermus aquaticus) and can therefore function at th ehigh temperatures used in th ethermocycler.
|
Do you know enough about gel electrophoresis?
Following PCR, it is imperative to visualize your DNA. Last week we calculated how much we "should" have. Now we need to ensure we still have DNA and that it is the right gene (the right length). We need to ensure we have copied the cytochrome b gene. To do this, we will use a technique called gel electrophoresis.
|

Please review the first 4m and 40s of this video from Khan Academy about gel electrophoresis. Review the bullet points below and the example image in the sidebar.

Review the gel example and accompanying explanation below. |
|
|
What will we do in lab & how will we do it?
During Lab 10, we studied DNA extraction and practiced on different types of fruit. We received the extraction results of our bushmeat samples and calculated the potential amount of mtDNA and of CYTb (our "GOI" gene of interest) we could have in our samples. Lastly you completed a virtual lab on PCR. For the purposes of Lab 11, let's assume the PCR has been run on the extracted products of our bushmeat samples. In this lab, we will continue with Gel Electrophoresis.
Lab will precede in three parts.
1) Make your gel: You will make a "gel" in a process similar to making Jello.
2) Conduct Gel electrophoresis (i.e., run your gel) : You will place a small amount of the PCR product from each bushmeat sample into the gel. If we synthesized the correct DNA, all our samples should be about 490 base pairs long.
3) Results: You will view these results to determine if our PCR was successful.

Click here to get to WKU's blackboard to take your LABridge for this week. Be sure your Notebook Entry from last lab is ready to submit!
Lab 11: ProtocolYour task in Lab 11 is to identify the species of origin of a meat sample from a Kenyan butchery.
Exercise I: Make your gel Exercise II: Conduct Gel electrophoresis (i.e., run your gel) Exercise III: Results: Review the results. |
Lab 10 - 12 Objectives (click to enlarge).
|
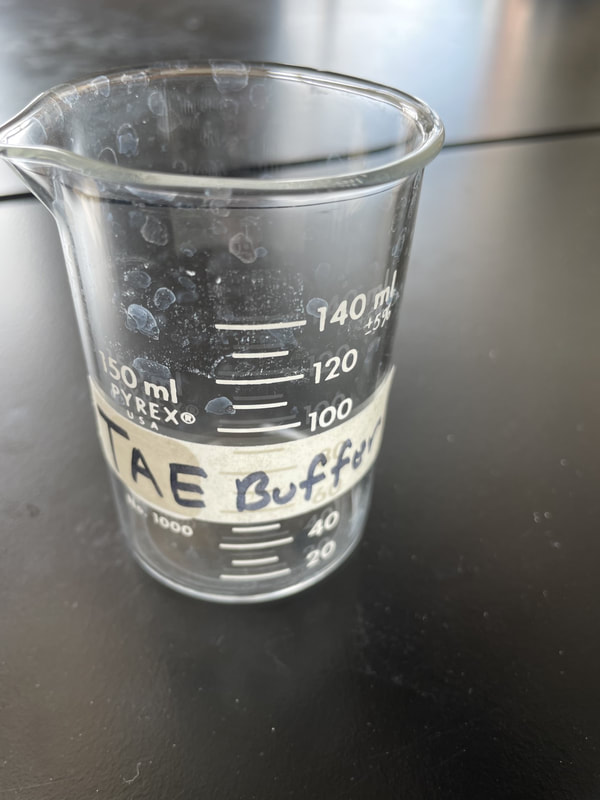
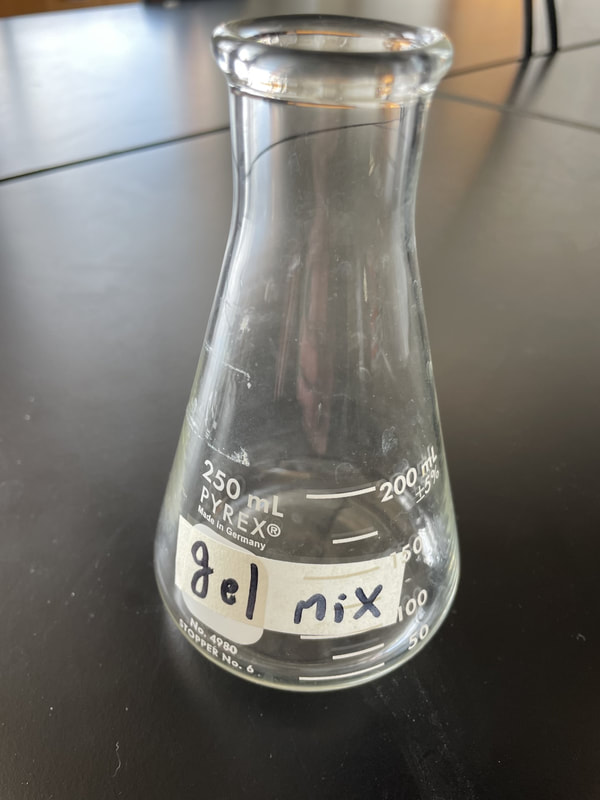
Exercise I. Making the Agarose Gel
So, did our PCR work? Were we able to amplify the DNA as intended? At this point in the process, we have no idea!!!! In fact we might not have ANY DNA. The calculations you completed in Exercise I are the best case scenario. The truth is PCR often fails. There are many reasons! Too much enzyme, low quality DNA, poor primers, low primer concentrations, incorrect PCR cycling, and so on! We need to SEE our DNA to know it exists and to confirm it is the right length!
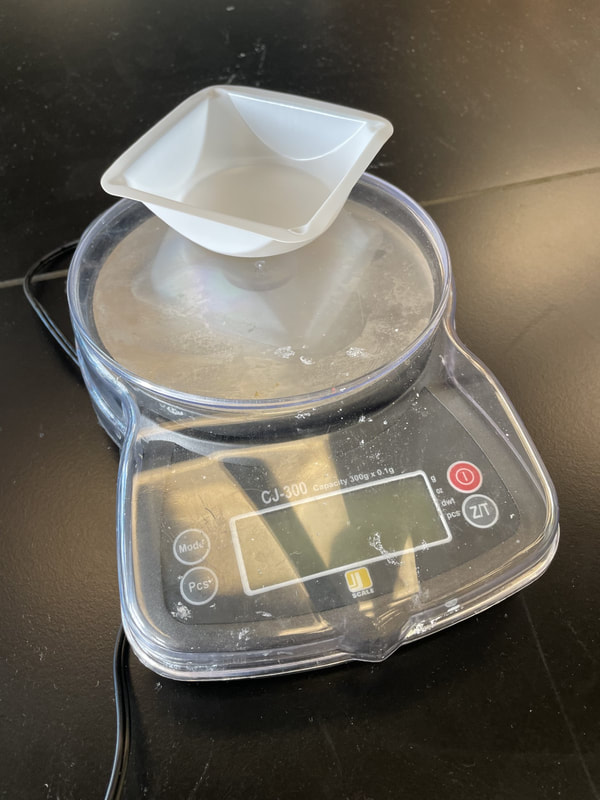
Materials.
|
Procedure: First we need to create our gel.
|
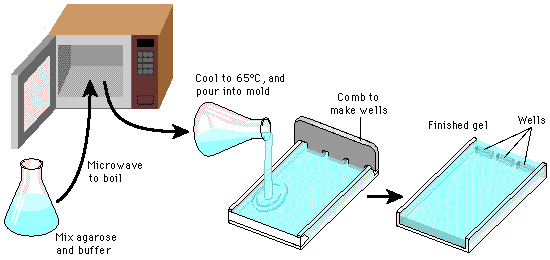
Basic gel creation process...it's like jello!
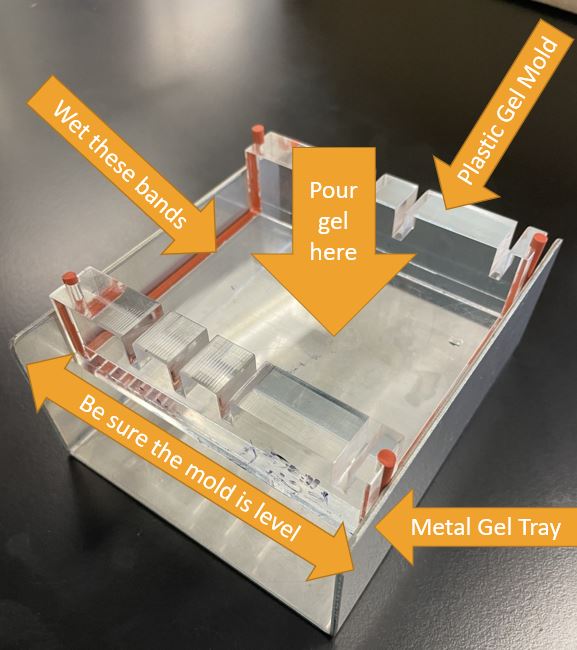
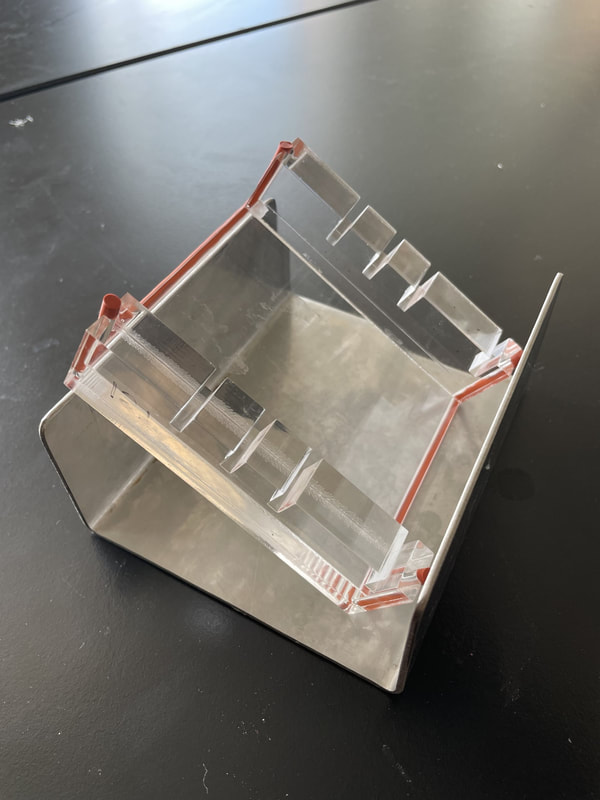
Casting tray and plastic mold used for setting gel. Click to enlarge.
|
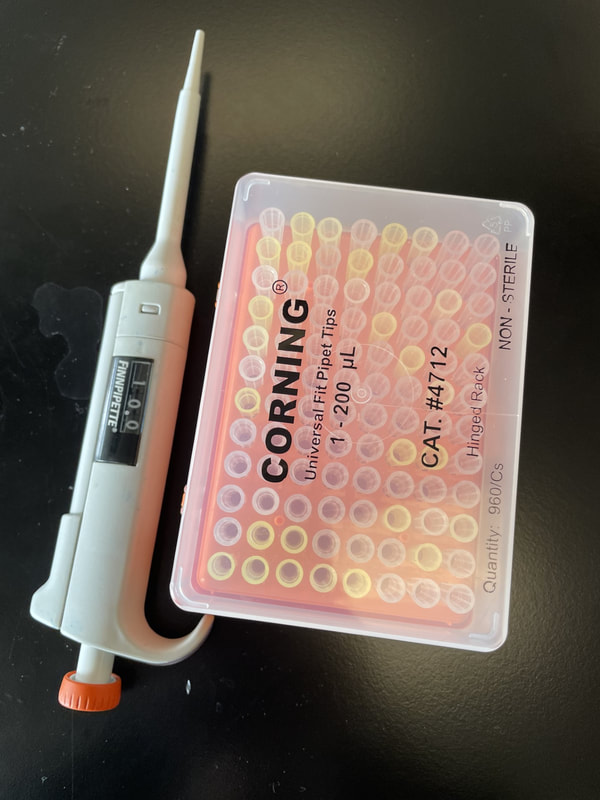
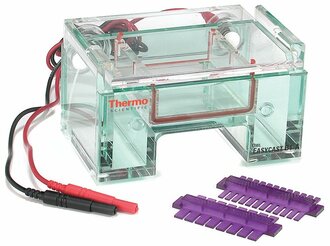
Exercise II. Loading & Running the Gel
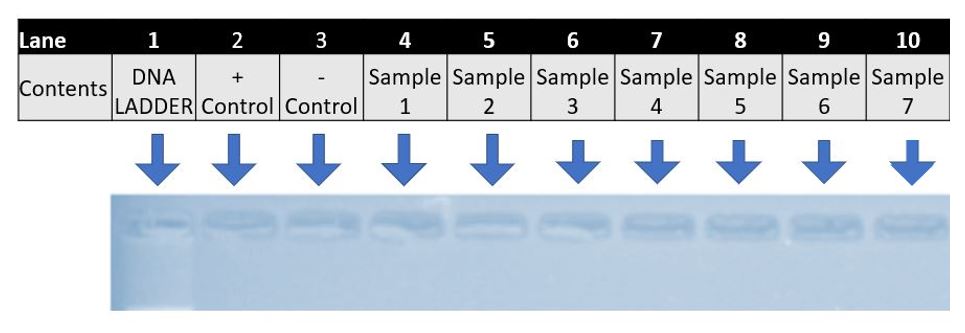
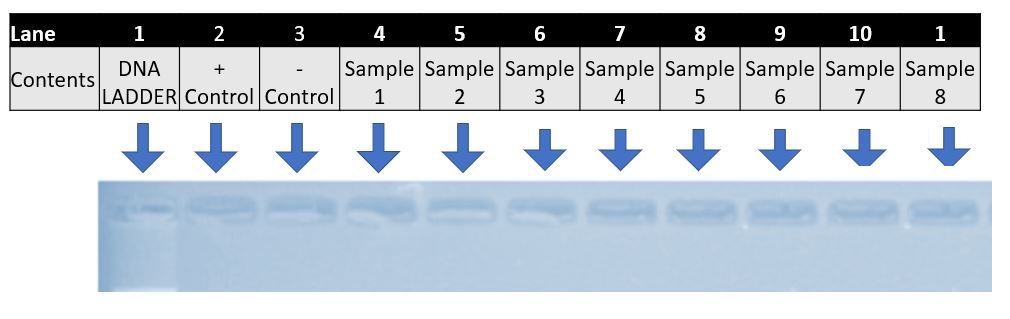
We will conduct agarose gel electrophoresis to confirm amplification of the right DNA. We need a 490 bp section of the cytochrome b gene. So all our samples should be approximately 490 bp in length and result in bands.
Materials.


|
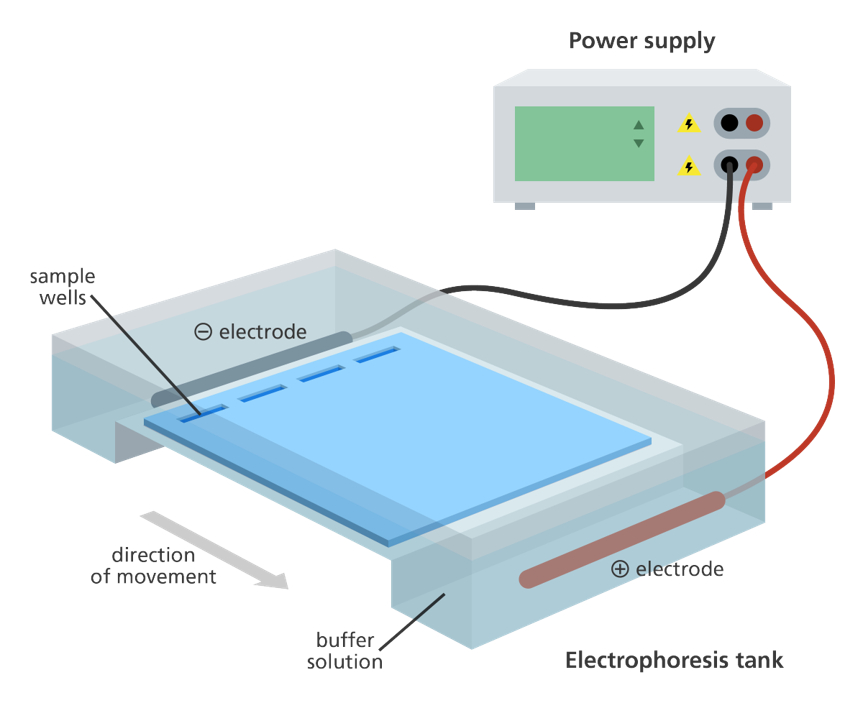
Procedure. Run your gel.
The red and black electrodes are plugged into the power supply and the current pushes your samples down the gel.
|

Diagram of electrical field and direction of migration. Click to enlarge.
What gets loaded where? Click to enlarge.
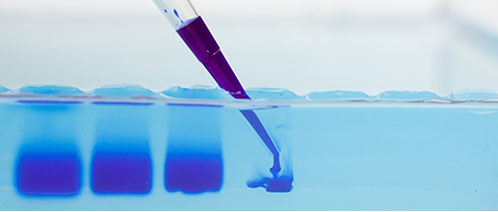
What is looks like to load a gel.

Gel chamber and electrodes pictured with combs to create loading wells.
|
We use two types of controls in DNA analysis. We start running both from the very beginning, through PCR, onto to gel electrophoresis and through to sequencing. If either control results in an incorrect identification, we have to start the ENTIRE process over and all our results are considered invalid
A positive control
- Is a known DNA sample with target DNA.
- It should always work well in your PCR and therefore, should always show up as expected in your gel (at the right length).
- It should always show up as the right sequence for identification.
- In this experiment we used impala DNA as our positive control or C+.
- At the end of all of our steps of DNA analysis, we should determine the species ID of this C+ to always be impala.
- This would be a positive result for bushmeat.
- This tests the success and validity of our protocol.
- If this C+ shows up to be ANYTHING BUT impala, all our results are invalid and we would need to start all over again with fresh extractions.
- Is a known sample with NO DNA.
- Following PCR is should NOT show up on your gel at all because there should be no DNA for amplification during PCR.
- It should never produce a sequence for identification.
- In this experiment (as in most) we used distilled water for our negative control or C-.
- At the end of all of our steps of DNA analysis, we should NEVER find any DNA from this sample.
- This tests for any contamination that may have occurred.
- For example, if we sequenced the C- and found human...we would have made a big mistake and would need start over again with fresh extractions.
- Or, for example, if we sequenced the C- and found cow or impala...we would have made another type of big mistake and would need start over again with fresh extractions.
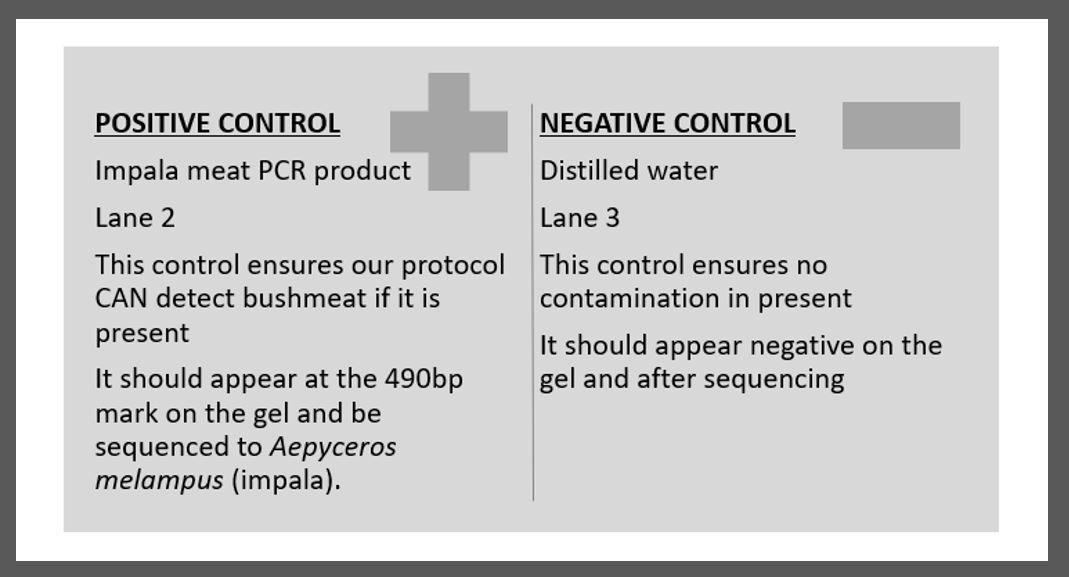
What are our controls? Click to enlarge.
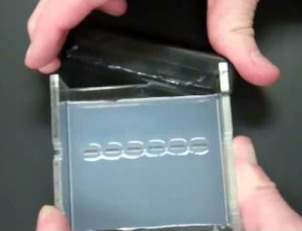
Exercise III. View & Analyze the Results
|
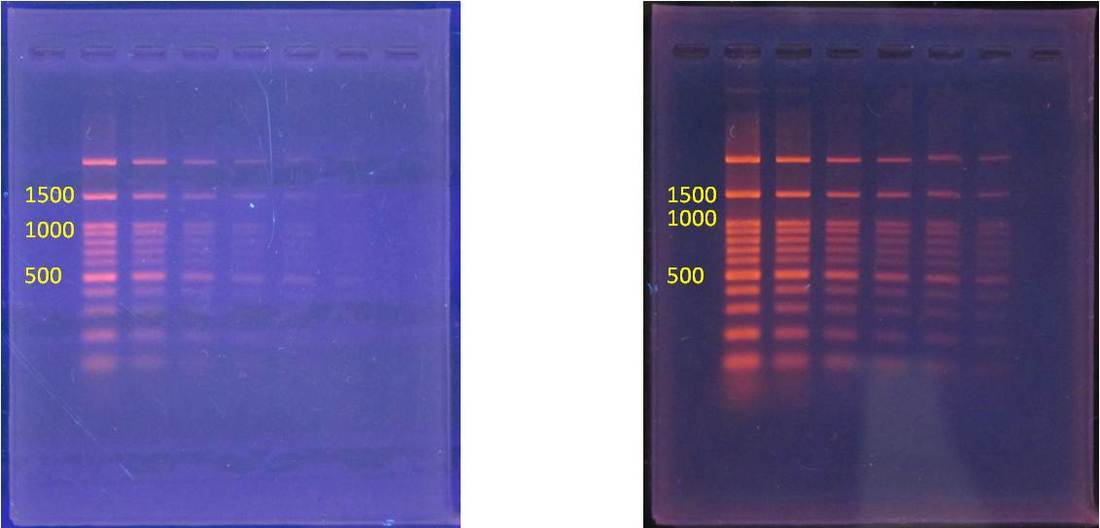
Example gels. Click to enlarge.
|
At the end of this first cycle, there are two DNA copies instead of the one original copy. The process continues, doubling the number of target DNA copies with each cycle.
The general formula for the number of DNA strands created by PCR is
N(2^n)
N = the number of original strands
n = the # of PCR cycles.
The general formula for the number of DNA strands created by PCR is
N(2^n)
N = the number of original strands
n = the # of PCR cycles.

|
Lab 11 BIOL 120 CONNECTIONS Section 1.6: Doing Biology Big Picture 1: How to Think Like a Scientist Chapter 4: Nucleic Acids Chapter 15: DNA and the Gene Chapter 20: The Molecular Revolution Chapter 54: Biodiversity and Conservation Biology *BIOL 122 |
|
The Department of Biology at WKU strives to create a dynamic, experiential learning environment, and to be a destination department for competitive undergraduate and graduate students, involving them in the process of science and preparing them for success in a global society. This website is intended solely for use of BIOL 121 students. The information here is copyrighted or within "Fair Use" under the scholarship or education exemption.
|
|
KAS citation format:
Mountjoy, N.J 2021. Title of page. Biological Concepts: Cells, Metabolism & Genetics. https://www.121cellmetagen.com. Date accessed (MM/DD/YYY).
Mountjoy, N.J 2021. Title of page. Biological Concepts: Cells, Metabolism & Genetics. https://www.121cellmetagen.com. Date accessed (MM/DD/YYY).