Lab 8: Pre-Lab
Your task in Lab 8 is to design and carryout an experiment regarding the rate of photosynthesis. You will use your research proposal to create an experimental protocol, and analyze provided your data as part of this lab. To prepare for Lab 8, please review this pre-lab page. Once you feel confident regarding the below topics, complete the corresponding LABridge in Blackboard.
Photosynthesis & The Light Reactions
CONNECTION ALERT! Cellular respiration is the topic of Chapter 10 in your BIOL 120 lecture. Please review your textbook as needed for this lab.
 Click to Enlarge
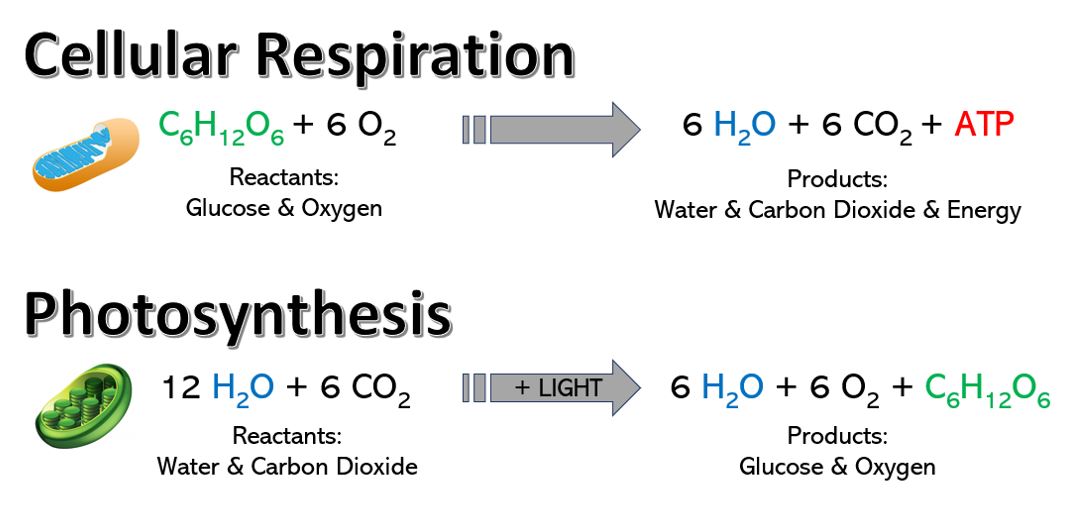
Review & Connections: Energy is the currency of life: all living organisms require energy to survive and reproduce. Metabolism is the series of reactions and processes, catalyzed by enzymes, which together maintain life. These reactions fall into two types: catabolic or anabolic. These processes are the inverse of each other and in photosynthetic organisms occur in tandem as the anabolic reactions of photosynthesis create the products that are then broken down by the catabolic reactions of cellular respiration.
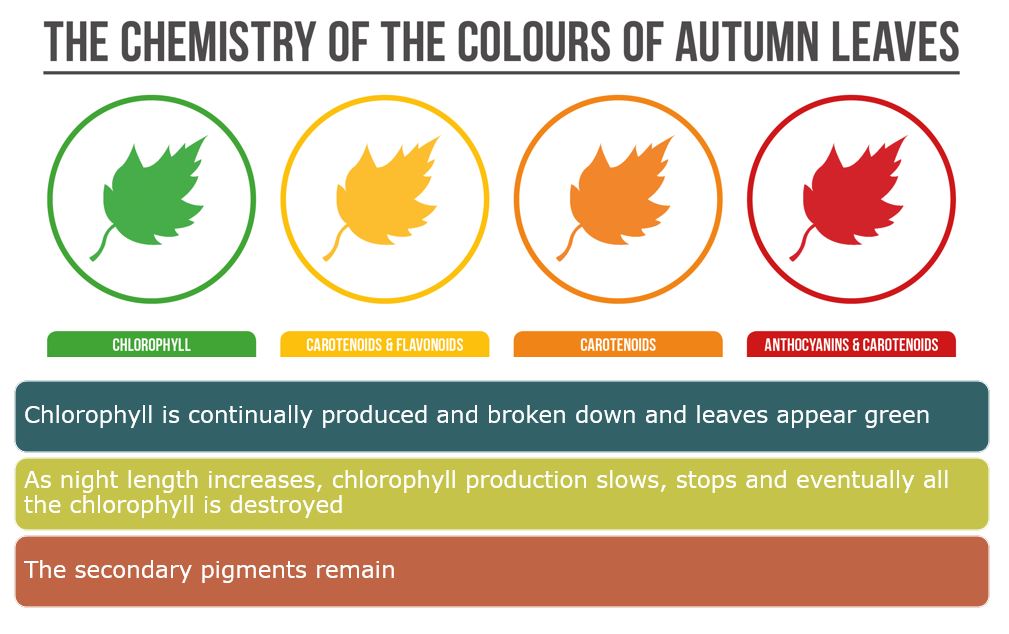
Photosynthesis is a light-dependent process in which radiant energy is captured, and converted to chemical energy which is then utilized to create fuel for organisms. Chlorophyll A is the primary photoreceptive pigment and is adept at absorbing wavelengths in the blue and red spectrum, but wavelengths in the green and yellow (500-600 nm) are transmitted, thus, most plants appear green. You should know about the other secondary pigments and with what colors they are associated.
There are two primary sets of reactions in photosynthesis.
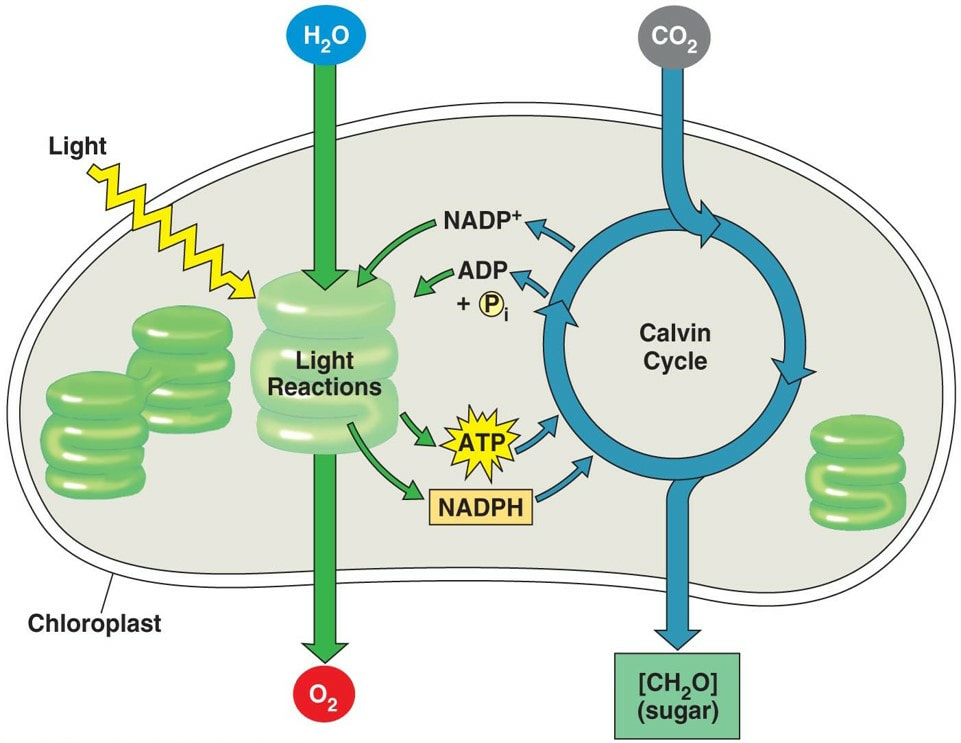
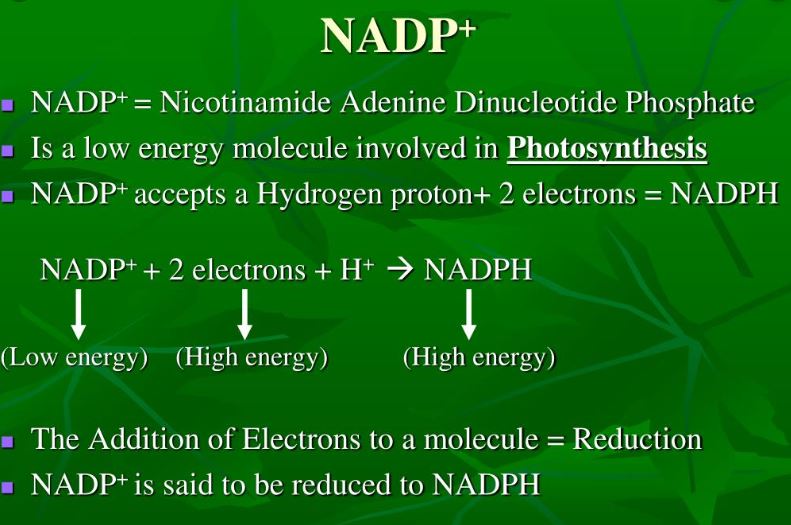
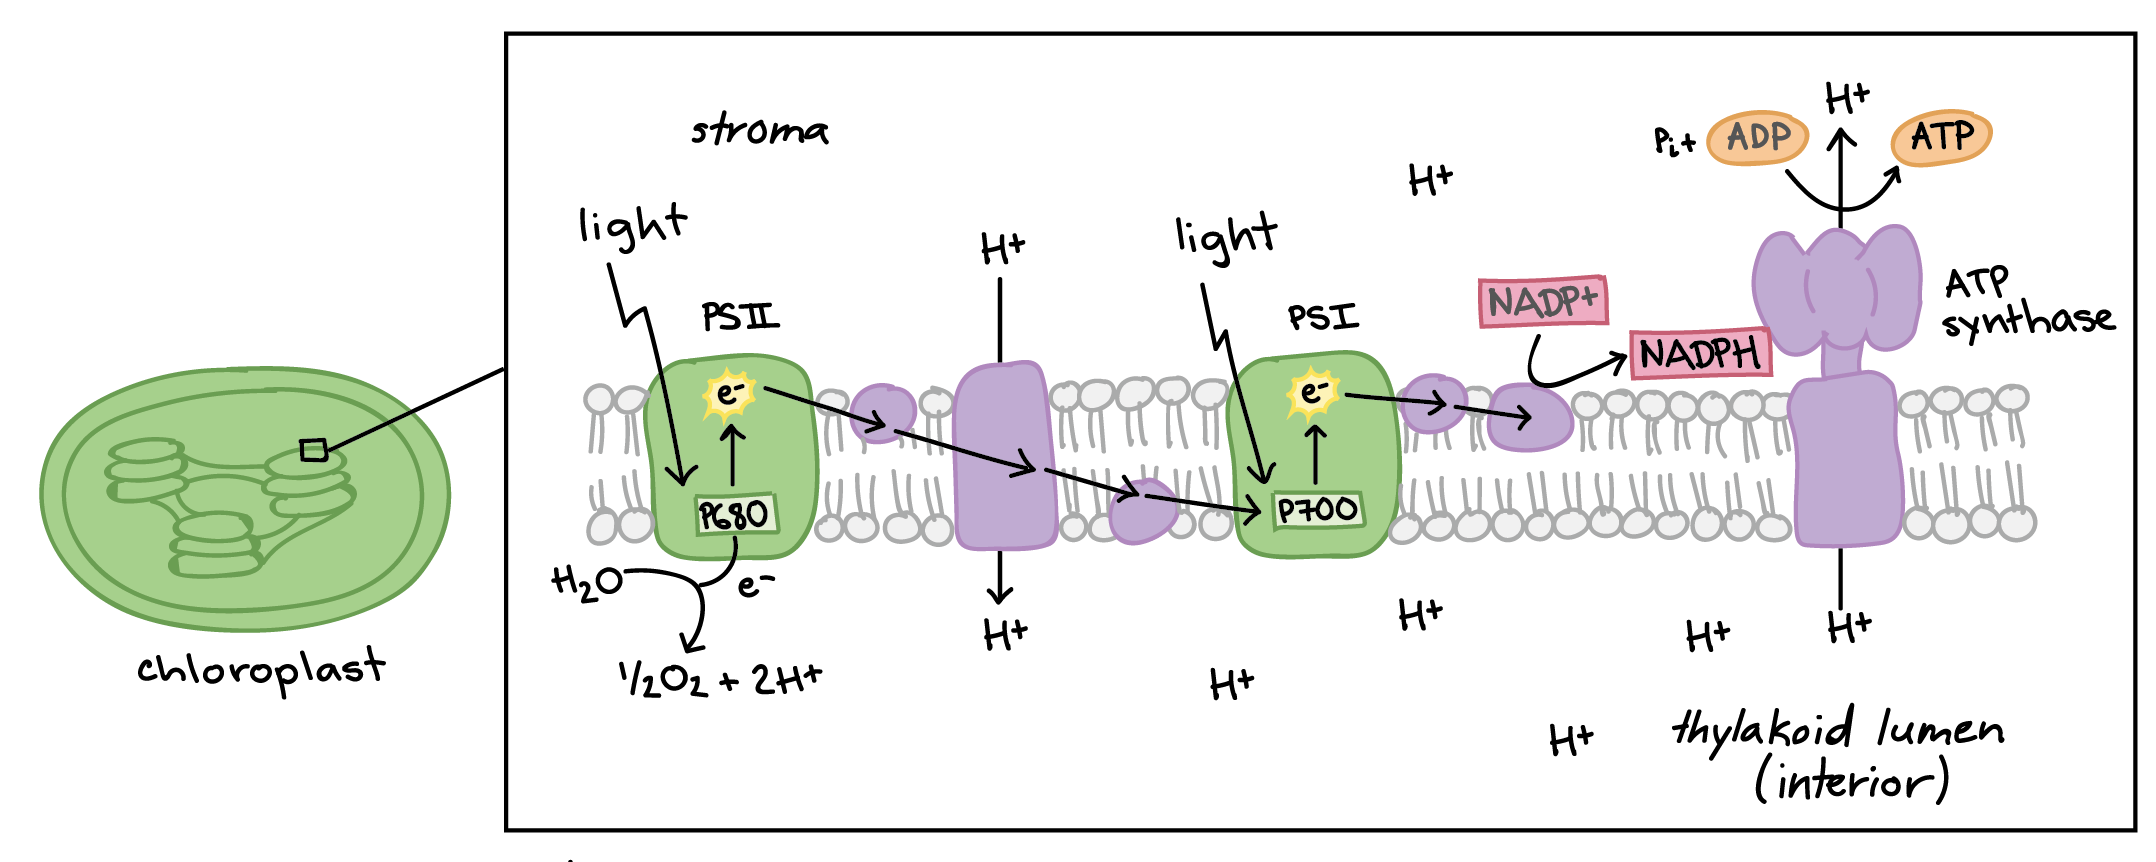
- The Light Reactions: The mechanism behind this important process starts with photoreceptive pigments within the chloroplasts of plant cells. When these pigments absorb light energy, they become excited, and along with the energy from splitting water, the process generates adenosine triphosphate (ATP) and NADPH, chemical forms of energy. *We will be measuring this process! Specifically, we will measure how quickly NADP+ is reduced to NADPH.
- The Calvin Cycle: The ATP and NADPH are then used to reduce CO2 and assemble glucose (C6H12O6), a common monosaccharide and major energy source for most living organisms. Often plants assemble glucose into the more complex polysaccharide of starch. Without the ability of photosynthesis to convert light into fuel, heterotrophs (all animals including humans) would cease to exist.

Please review the light reactions and the Calvin cycle.

Be sure you know the basic steps of photosynthesis, and the reactants and products. Could you write the full equation? Be sure you understand the reduction of NADP+ to NADPH.
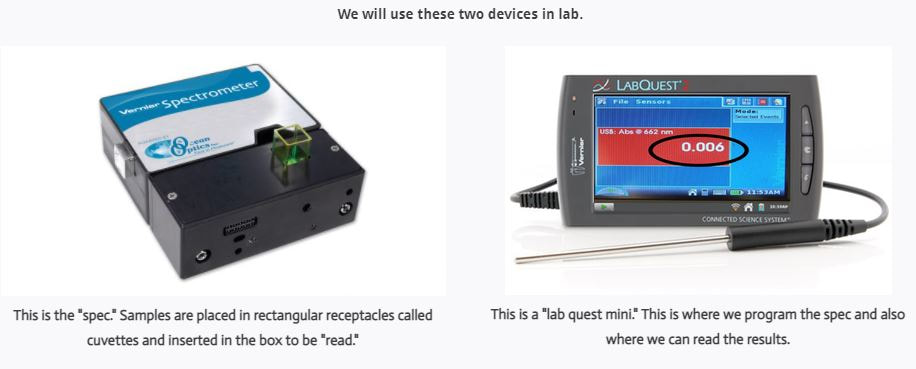
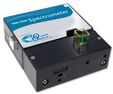
Do you know enough about spectrophotometry?
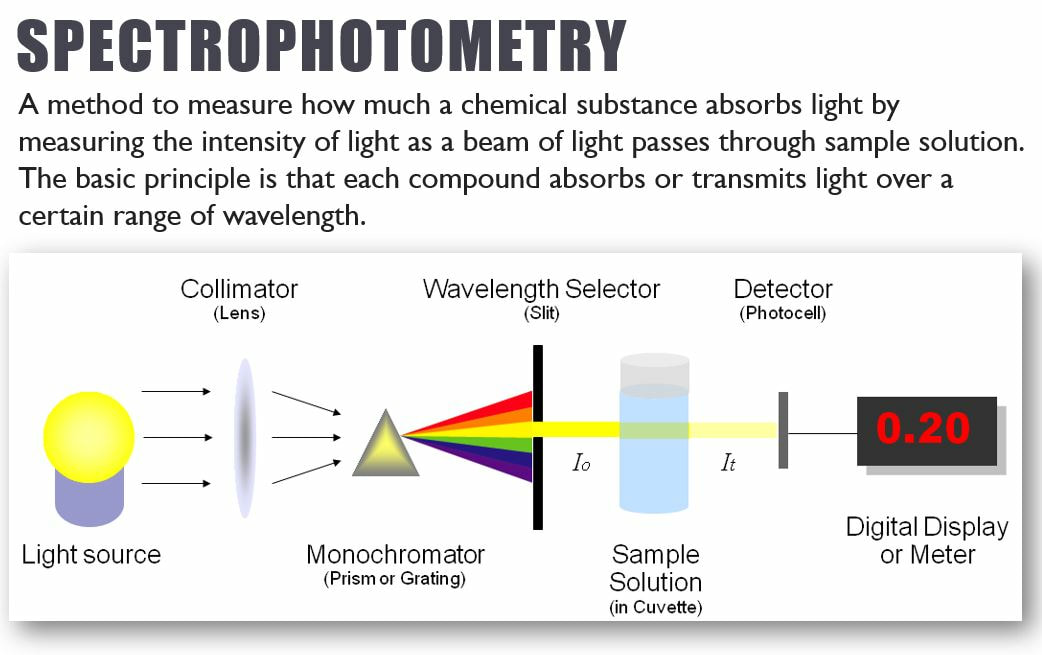
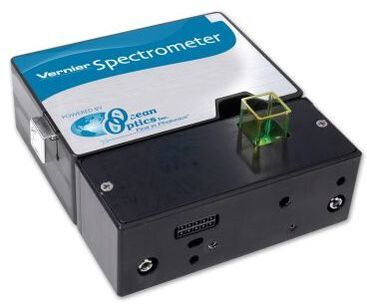
Spectrophotometry is the technique we would have used in lab this week. It is a technique that can be used to identify unknown concentrations in a sample, based on its color! In our lab, samples that undergo a lot of photosynthesis will become a lighter color purple. Solutions that undergo little photosynthesis will stay a darker color purple.
|
Spectophotometry uses the principles of light and color to help identify concentrations of various components in a solution.
Wavelengths of light are associated with various colors due to their frequency. When light hits an object or solution (like a plant leaf in the figure at right), wavelengths are either absorbed or reflected/transmitted. We see color based on the associated wavelengths that are transmitted or reflected. We do not see the colors associated with the wavelengths that are absorbed.
For example, view the absorption spectrum for typical plant pigments (graph in the sidebar). The graph shows that when light hits a plant, purple, blue, red, and orange wavelengths have high absorbance values, meaning they are mostly absorbed by the plant and we don not see these colors. Green and yellow wavelengths have low absorbance values- meaning they are reflected... this is what gives plants their green color! When a color-sensitive indicator is used the absorbance values are directly proportional to the concentration in the solution.
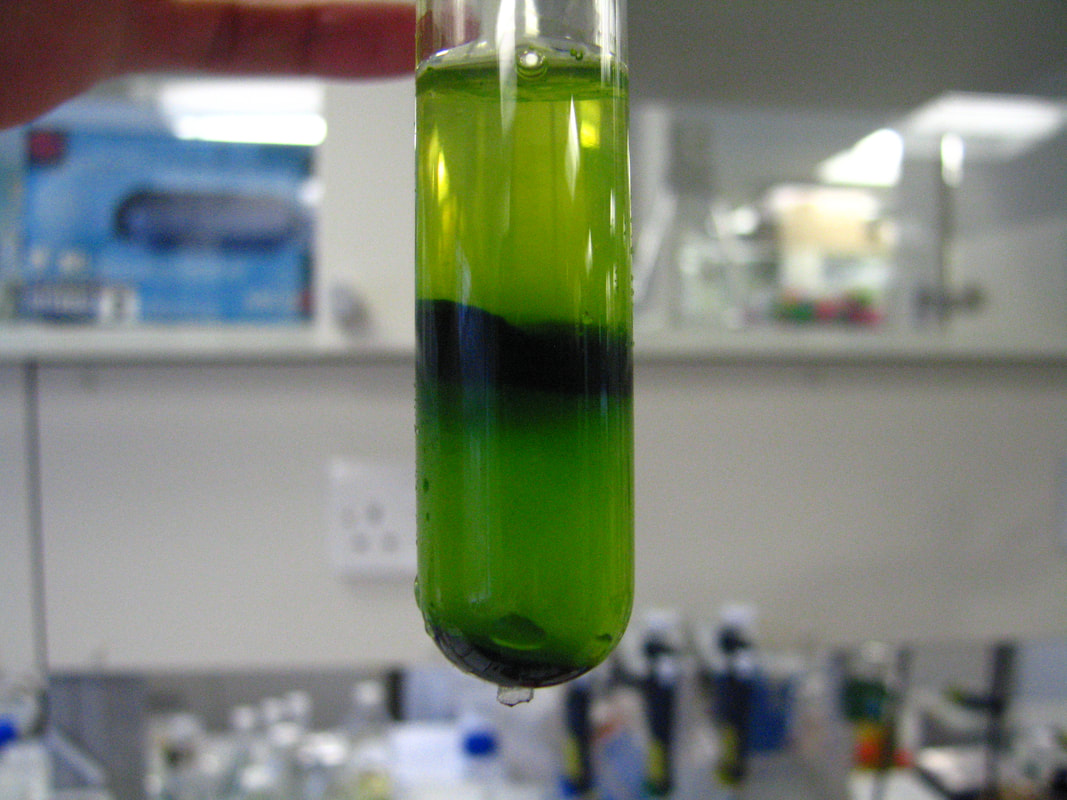
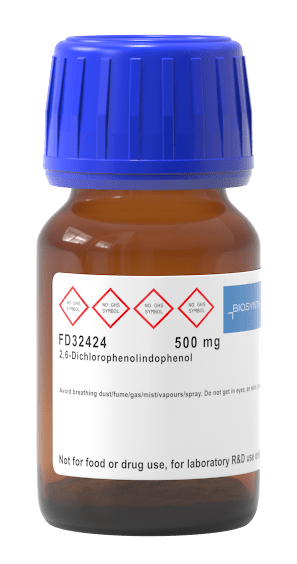
Recall that during the light reactions of photosynthesis, a molecule called NADP+ is reduced to NADPH (energy is loaded onto it in the form of electrons). So the rate at which NADP+ becomes NADPH approximates the actual rate of photosynthesis. In our lab this week, we will be using something called DIP as a substitute for NADP+. DIP = NADP+ DIPH = NADPH DIP is a dark purple color. As the light reactions of photosynthesis proceed, the DIP becomes lighter and lighter as it is reduced to DIPH (like NADP+ to NADH). BUT! We cannot see the subtle changes in color. Instead, we will use the spec to determine the value of the color, as measured by its absorbance.
|
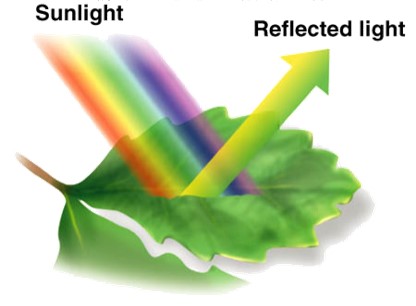
We see the color of the wavelengths that are transmitted or reflected. We do not see the colors of wavelengths that are absorbed.
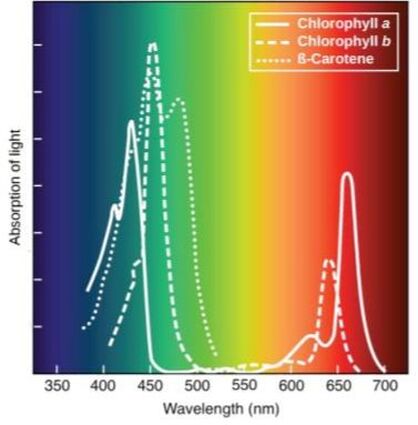
Absorption spectrum for typical plant pigments
Click here for a review on spectrometry.
|

Can you answer these questions? What is a spec? How does it work? How will we use it in lab? What is DIP? How can it tell use anything about the rate of photosynthesis? What is the relationship between the solution's color and the rate of photosynthesis?

If you can easily answer the questions above, you are ready to move on. If not, please review the content on this page further.
What will we do in lab?
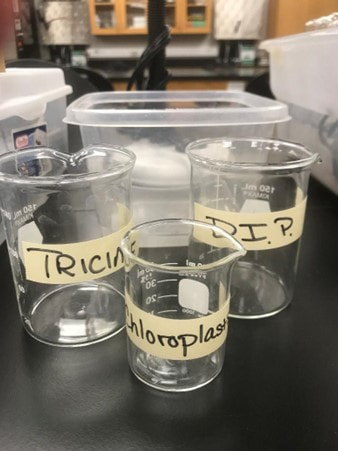
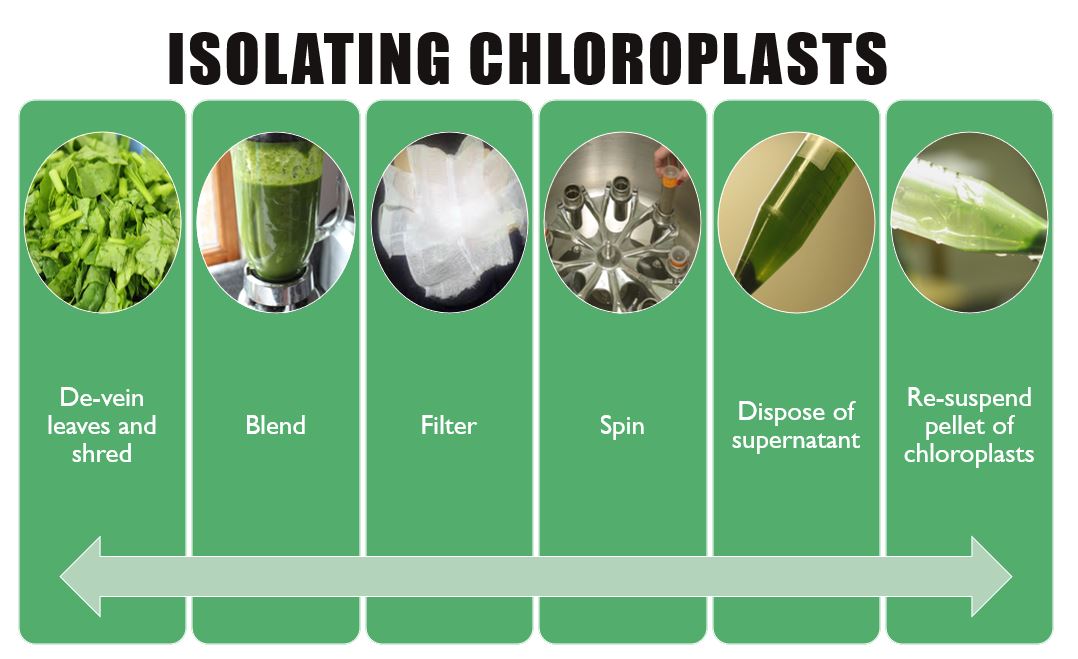
Specifically, we were going use isolated chloroplasts suspended in solution and expose them to the variable(s) of your choice. We would have then measured the rate of the light reactions by determining how much NADPH (really DIPH) is produced by our active chloroplast.

Read about the general procedure we will use. Yours will be different based on the variables you have decided to test.
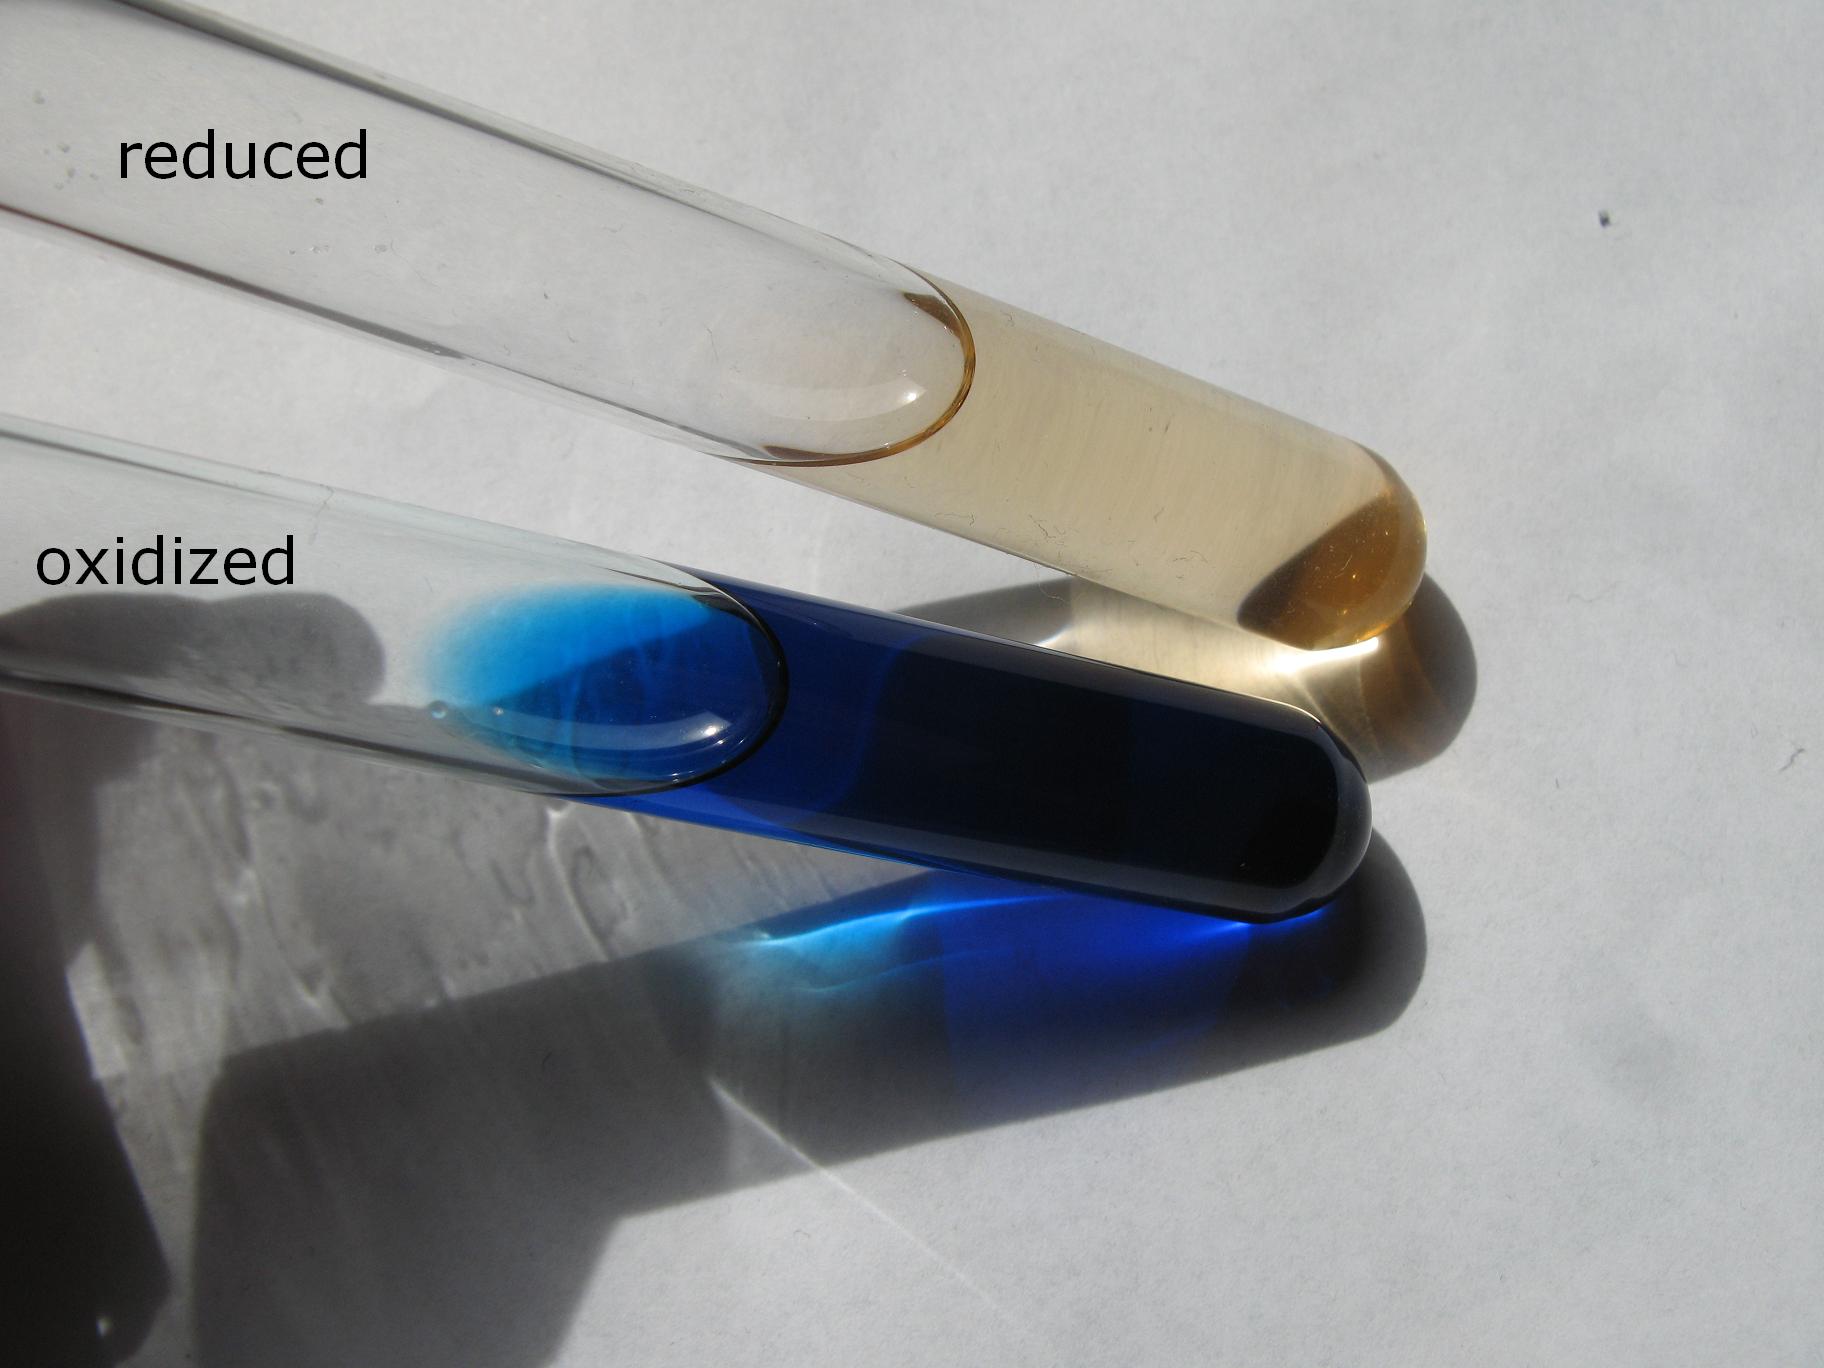
REMINDER: What the heck is DIP? Normally, the light reactions require NADP+. Photons excite electrons and they are used to reduced NADP+ to NADPH (which is then used in the Clavin Cycle). Instead of adding NADP to "feed" our chloroplasts, we are adding DIP as a stand in. This is because DIP is color reactive, meaning we can use color changes to determine how much DIP is reduced to DIPH. That is how we will determine the rate of the light reactions in our differing environments: DIP is a blue/purple color, as it is reduced to DIPH the color intensity is diminished, it gets closer to clear.
|
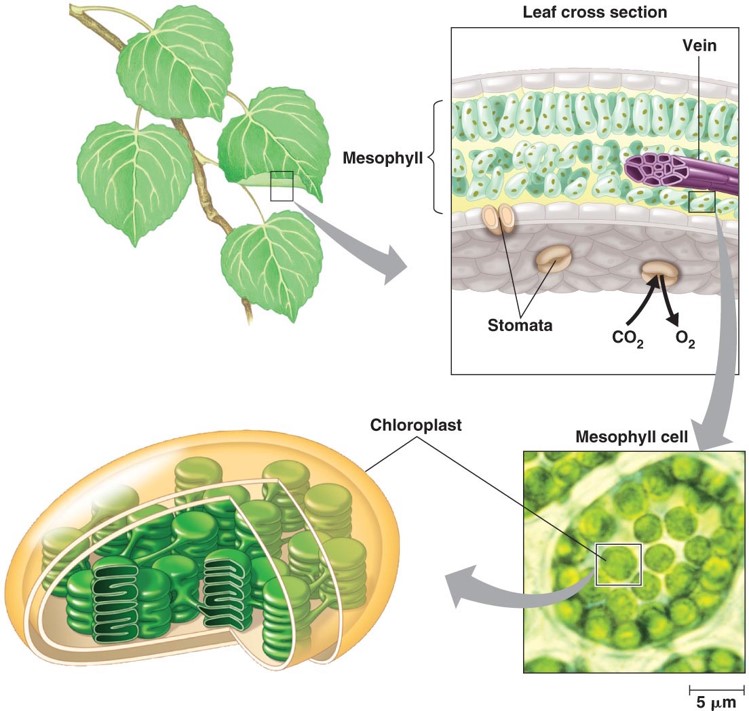
Chloroplast diagram. Click to enlarge.

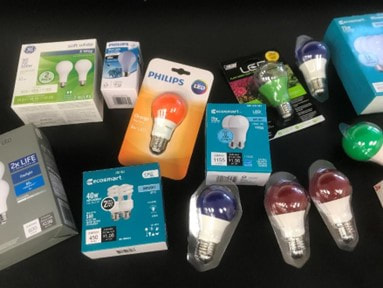
Potential test tube environments.
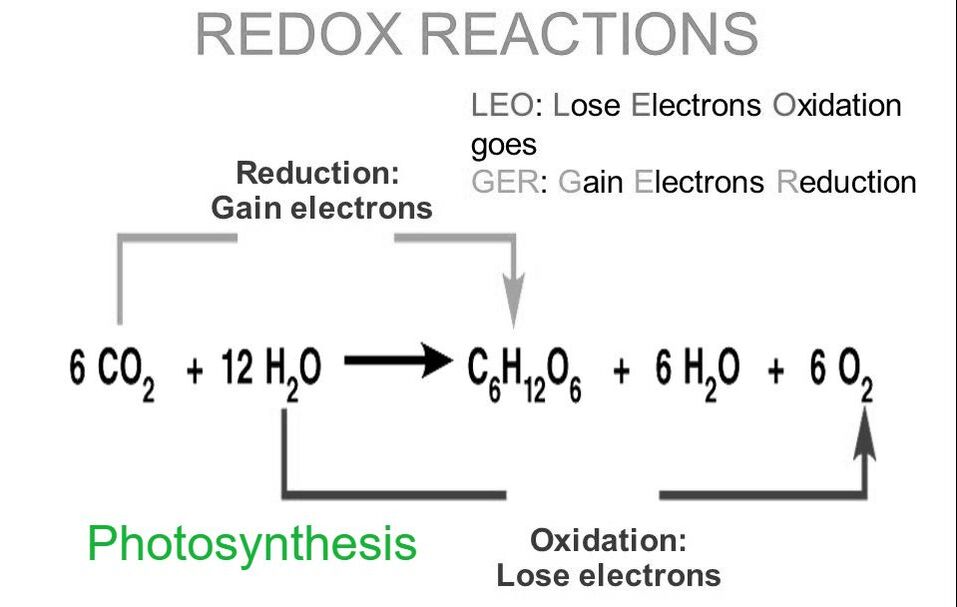
The complete photosynthesis reaction with redox labels. Click to enlarge.
|

Be sure you understand the relationship between absorbance values and rate of the light reaction. Review the chloroplast diagram and be certain you know the equation for photosynthesis, what gets oxidized and what gets reduced.
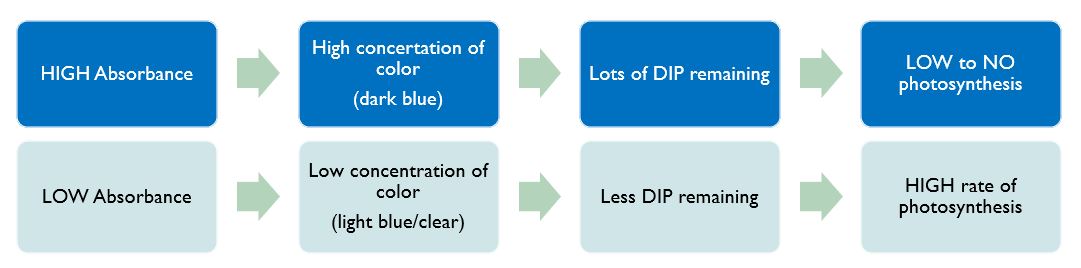
Relationship between absorbance values and rate of the light reaction.

Click here to get to WKU's blackboard to take your LABridge for this week. Be sure your Notebook Entry from last lab is ready to submit!
Lab 8: ProtocolIn today's lab you will work with your lab group to review and revise your photosynthesis research proposal, conduct your experiment and analyze your data.
Exercise I. Review/revise your proposal Exercise II. Conduct your experiment & collect data Exercise III. Begin to analyze your data |

Lab Objectives: Following today's lab, you should be able to...
|
Exercise I. Review & Revise
|
Procedure
|
Lab 8 Notebook Guide. Click to download.

Takes pics for your poster!
Photosynthesis Review.
|
Exercise II. Run your experiment & collect data
Recall that during that the rate at which NADP+ becomes NADPH approximates the rate of photosynthesis. In our lab this week, we will be using DIP as a substitute for NADP+ (DIP = NADP+ -AND- DIPH = NADPH). DIP is a dark purple color. As the light reactions of photosynthesis proceed, the DIP becomes lighter and lighter as it is reduced to DIPH (like NADP+ to NADH). BUT! We cannot see the subtle changes in color. Instead, we will use the spec to determine the value of the color, as measured by its absorbance.
- If the solution remains dark, that means there is a high concentration of DIP remaining, and the spectrophotometer will read high absorbance values = low/slow rate of photosynthesis.
- If the solution lightens, that means there is a low concentration of DIP remaining (a lot was reduced to DIPH), and the spectrophotometer will read low absorbance values = fast/high rate of photosynthesis.
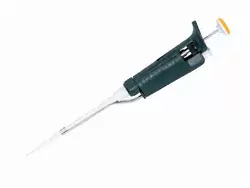
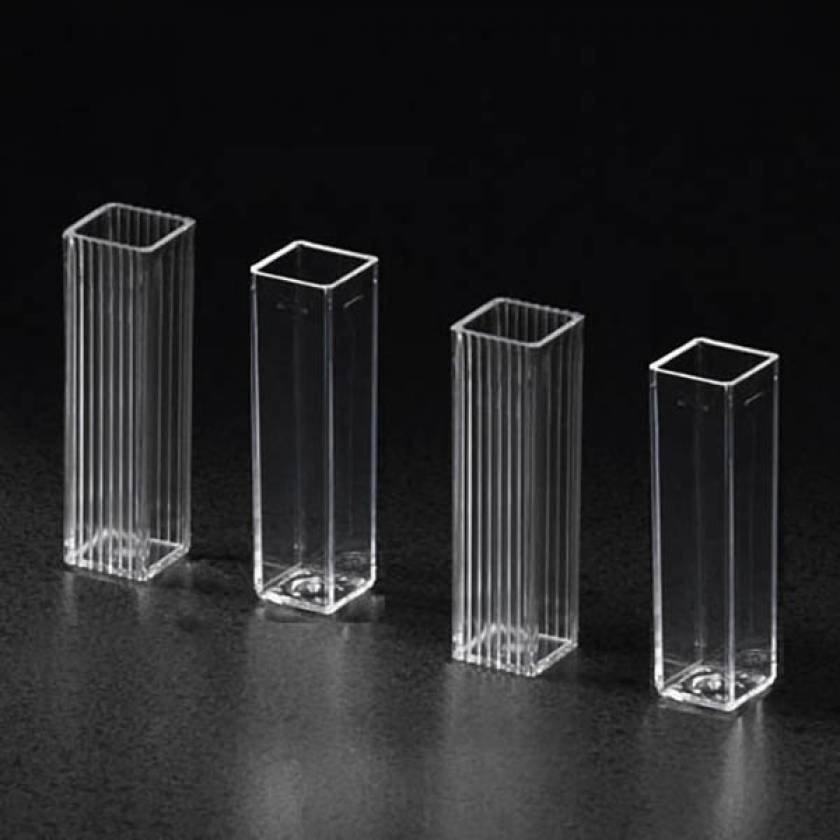
Materials.
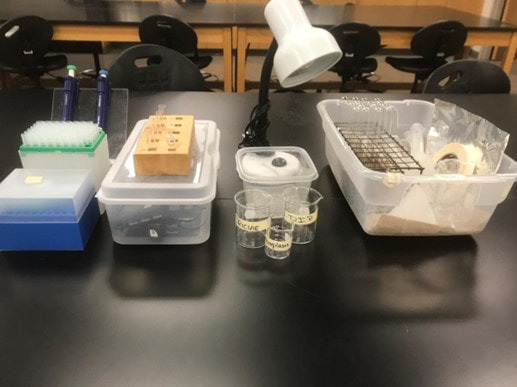
Protocol.
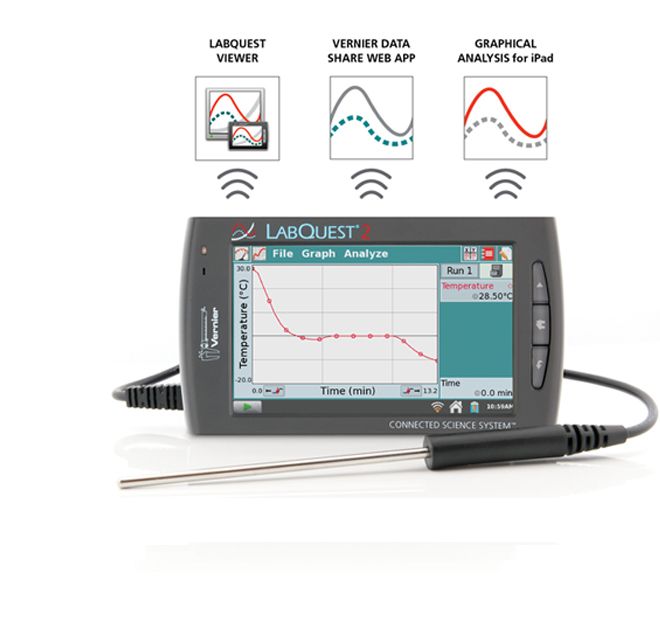
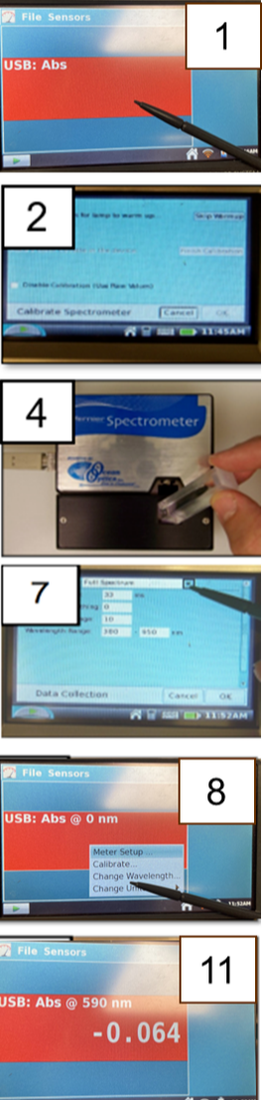
A) Set-up your photo-spectrometer (spec)
Procedure.
Spectophotometry uses the principles of light and color to help identify concentrations of various components in a solution. These steps will get your equipment set-up for your experiment.
Spectophotometry uses the principles of light and color to help identify concentrations of various components in a solution. These steps will get your equipment set-up for your experiment.
|
Power on LabQuest 2
|
|

Click here for a review.
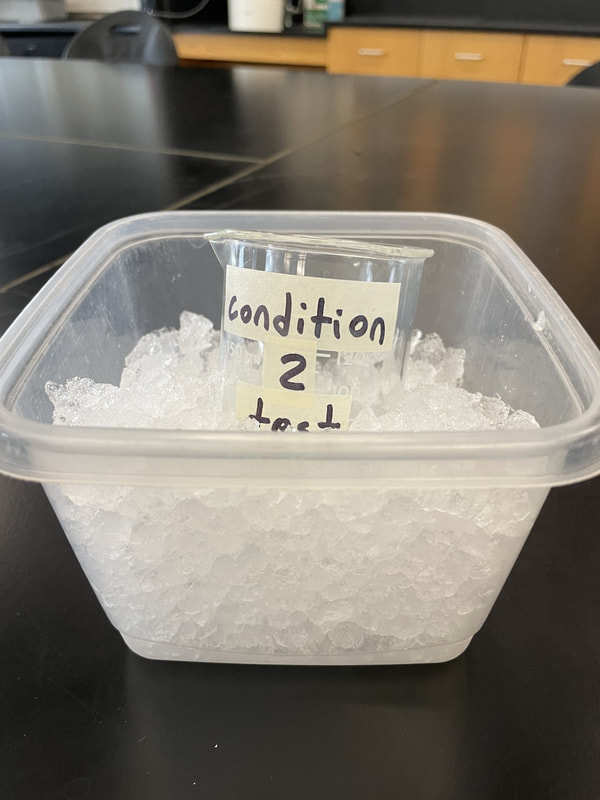
B) Experimental Control (test your chloroplasts in condition 1)
Procedure.
You can test five tubes at a time. At a minimum, you should test 5 tubes in condition 1, and then five tubes in condition 2, depending on the variable you are testing.
You can test five tubes at a time. At a minimum, you should test 5 tubes in condition 1, and then five tubes in condition 2, depending on the variable you are testing.
|

Potential test tube environments.

The minute your chloroplasts go into your test...they will start working.
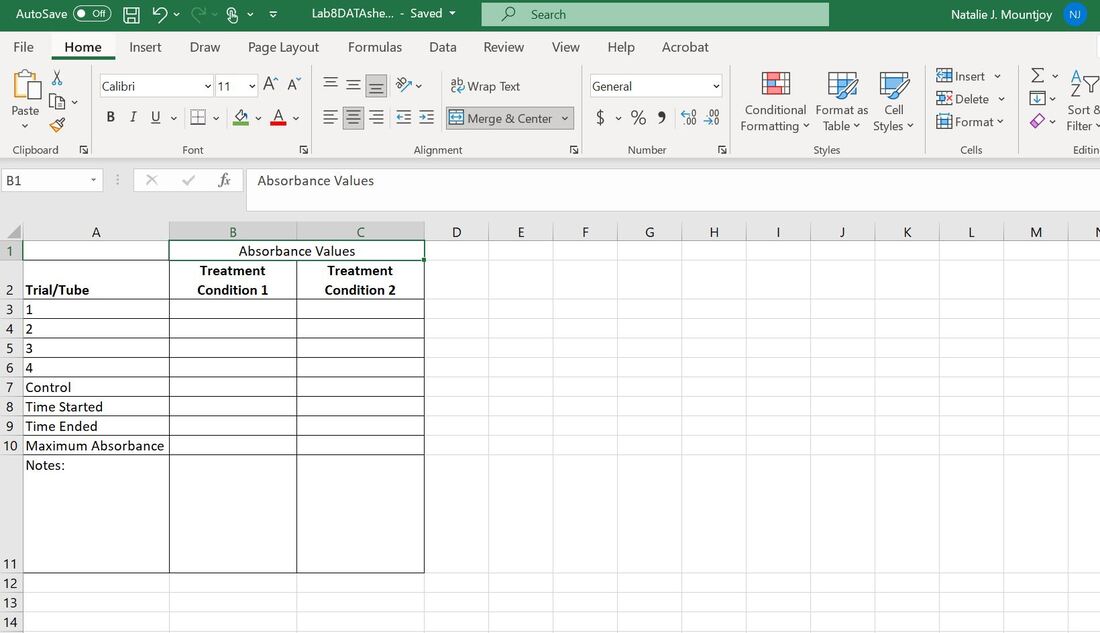
Lab 8 data collection Excel sheet. Click to download.
|
c) Experimental Treatment (test your chloroplasts in condition 2)
Procedure.
You can test five tubes at a time. At a minimum, you should test 5 tubes in condition 1, and then five tubes in condition 2, depending on the variable you are testing.
You can test five tubes at a time. At a minimum, you should test 5 tubes in condition 1, and then five tubes in condition 2, depending on the variable you are testing.
|

The minute your chloroplasts go into your test...they will start working.
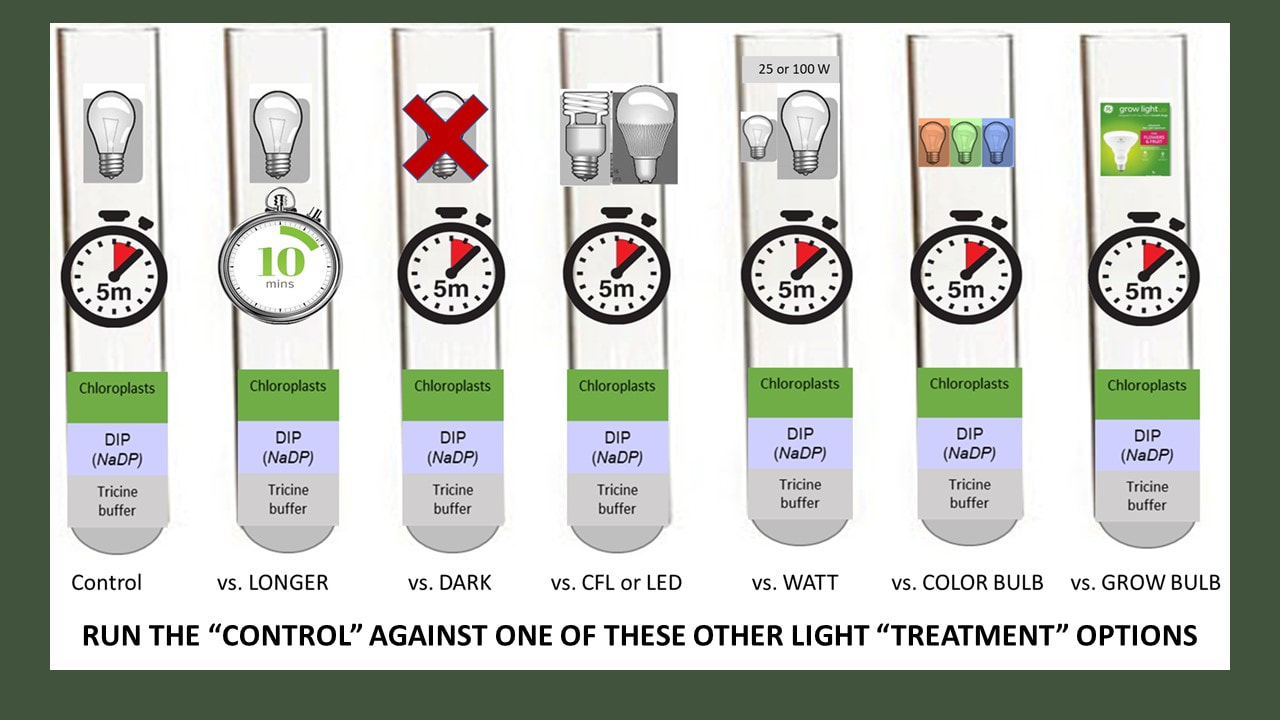
Potential test tube environments.
|
|
Remember why we are using the spec! During the light reactions of photosynthesis, a molecule called NADP+ is reduced to NADPH, and the rate this occurs approximates the rate of photosynthesis. We use DIP as a substitute for NADP+. The color of DIP (which can be read by the spec) lightens as it is reduced to DIPH (as photosynthesis occurs). We cannot see the color change but it results in changing absorbance values which can read by our specs. Lighter color >> Lower Absorbance Values >> Higher rate of Photosynthesis.
|
Exercise III. Analysis
We will complete another t-test to determine if the mean photosynthetic rate between our 2 groups is significantly different. We need to determine if the mean absorbance values produced in your two conditions are close enough to be the same or far enough a part to be different.
Remember: Statistics solve the problem of determining if "more" or "higher" or "different" than is actually enough to be important and biological relevant. Using the principles of probability, they help us parse what we observe from randomness (chance alone) as meaning (a real difference, or a real relationship). Statistics tell us how likely we would be to make the same observations we have made, if chance and randomness were the only drivers. If the probability is very low (<5%), we refer to these patterns as significant.
|
Procedure
Just like our respiration experiment, comparing the single data points you have are an OK way to test for differences in photosynthetic rate. But, a t-test can determine if your measurements are significantly different, allowing you to reject your null hypothesis. These directions are exactly like the process we used Lab 7.
|

Visit the stats section of our research library.

T-test Online Calculator.
|
You get to decide which project (Lab 7 or Lab 8) you'd like to include in your scientific poster. All the directions, rubrics and templates for this assignment are located on the next tab. Please review the syllabus for due dates.
Get Started on your Posters!
Each team member MUST submit your poster individually in blackboard before the due date/time. You can turn in a completed draft for feedback before you final is due is you would like. Final posters will not be accepted late, even if others from your group already turned them in.

You already have a lot of what you need!
Your research proposal has research that gets your introduction started. Use the research library for more! Your proposal and the protocol you developed in your lab notebook will provide the bulk of the methods section.
In your methods section, be sure to detail what you WOULD have done in lab had we met, DO NOT include the methods for the virtual labs we used as substitutions.
Your Lab Notebook also has all the results you need plus some good points to include in your discussion!
SOME SUGGESTIONS FOR A GREAT POSTER
- Studies show that you have only 11 seconds to grab and retain your audience's attention so make the punchline prominent and brief.
- Most of your audience is going to absorb only the punch line. Those who are directly involved in related research will seek you out anyway and chat with you at length so you can afford to leave out much of the details and tell those who are really interested the "nitty-gritty" later.
- Graphic materials should be easily visible from a minimum distance of 6 feet. For general text, 18 point is readable.
- For section headings (Introduction, Methods, etc.) use Helvetica or Arial, Boldface, 36 point. Keep in mind that san serif fonts (having characters without curlicues or other embellishments) are easiest to read, particularly from a distance.
- Use left-justification; text with even left sides and jagged right sides is much easier to read.
- Edit Ruthlessly! There ALWAYS is way too much text in most posters. Posters primarily are visual presentations; the text materials serve to support the graphic materials. On average the total amount of space should include about 30% text, 50% graphics and 20% empty space.
- Spatial organization makes the difference between reaching 95% rather than just 5% of your audience. Time spent hunting for the next idea or piece of data is time taken away from thinking about the science. Arrange the contents in a series of 3, 4, or 5 columns. Columns facilitate the flow of traffic past the poster remembering that people read from the upper left downward.
- What to include? Images of crayfish or chloroplasts, important equations, important molecules, your own pictures from lab, flow charts or illustrations...think outside the box

|
Lab 8 BIOL 120 CONNECTIONS Section 1.6: Doing Biology Big Picture 1: How to Think Like a Scientist BioSkillls 2: Reading & Making Graphs BioSkillls 3: Interpreting Standard Error and Using Statistical Tests BioSkillls 4: Working with Probabilities Chapter 10: Photosynthesis |
|
The Department of Biology at WKU strives to create a dynamic, experiential learning environment, and to be a destination department for competitive undergraduate and graduate students, involving them in the process of science and preparing them for success in a global society. This website is intended solely for use of BIOL 121 students. The information here is copyrighted or within "Fair Use" under the scholarship or education exemption.
|
|
KAS citation format:
Mountjoy, N.J 2021. Title of page. Biological Concepts: Cells, Metabolism & Genetics. https://www.121cellmetagen.com. Date accessed (MM/DD/YYY).
Mountjoy, N.J 2021. Title of page. Biological Concepts: Cells, Metabolism & Genetics. https://www.121cellmetagen.com. Date accessed (MM/DD/YYY).